序論と主要指標
国や地域によって傾向は大きく異なるが、離婚は過去数十年の間に世界中でますます一般的になっている。世界的に見ると、粗離婚率(人口1,000人当たりの年間離婚件数)は1970年代から2000年代にかけて約2倍に増加した。例えば、欧州連合(EU)の離婚率は、1970年から2000年にかけて約2倍に上昇した。 1964年、人口1,000人当たり0.8人 への 2023年には1,000人当たり2.0人同じ期間に婚姻率が50%も低下しているにもかかわらず、である。しかし、離婚のパターンは一様ではなく、それぞれの国の社会規範、法的枠組み、人口動態を反映している。離婚を測定する2つの重要な方法がある:
- 粗離婚率: ある年の人口1,000人当たりの離婚件数。これは、人口における離婚の年間頻度を示している。
- 離婚率(離婚の割合): 婚姻件数に対する離婚件数で、しばしばパーセンテージで表される(例:婚姻件数100件あたりの離婚件数)。これでおおよその 生涯リスク 結婚が最終的に離婚に至ることを示す。例えば、50%の比率は、結婚の約半数が離婚に至ることを示唆している。
これらの指標を文脈に沿って解釈することが重要である。粗率は、未婚人口の割合や年齢構成によって影響を受ける可能性がある。離婚率は、生涯離婚リスクを大まかに推定したもので、現在の結婚と離婚のパターンが一定であると仮定しているが、実際の生涯離婚率は、結婚コホートを時系列で追跡することによって算出される。それでも、これらの指標を合わせれば、離婚の有病率に関する有用なイメージが得られる。
国別離婚統計(最新データ)
以下の表は、信頼できるデータが入手可能な国の離婚率であり、最新のデータ年、粗離婚率、粗婚姻率、離婚に至った婚姻の推定割合(離婚対婚姻率)を含む。これにより、離婚普及率の国別内訳を知ることができる。
ヨーロッパ
ヨーロッパは世界で最も離婚率の高い国のひとつである。多くのヨーロッパ諸国や旧ソビエト諸国では20世紀後半に離婚が急増し、現在では結婚の40-90%が離婚に至っている。これとは対照的に、最近になって離婚が合法化あるいは正常化されたヨーロッパの数カ国は、離婚率がかなり低い。
| 国名 | データ年 | 人口1,000人当たりの離婚件数 | 人口1,000人当たりの婚姻件数 | 離婚に至る結婚の% |
|---|---|---|---|---|
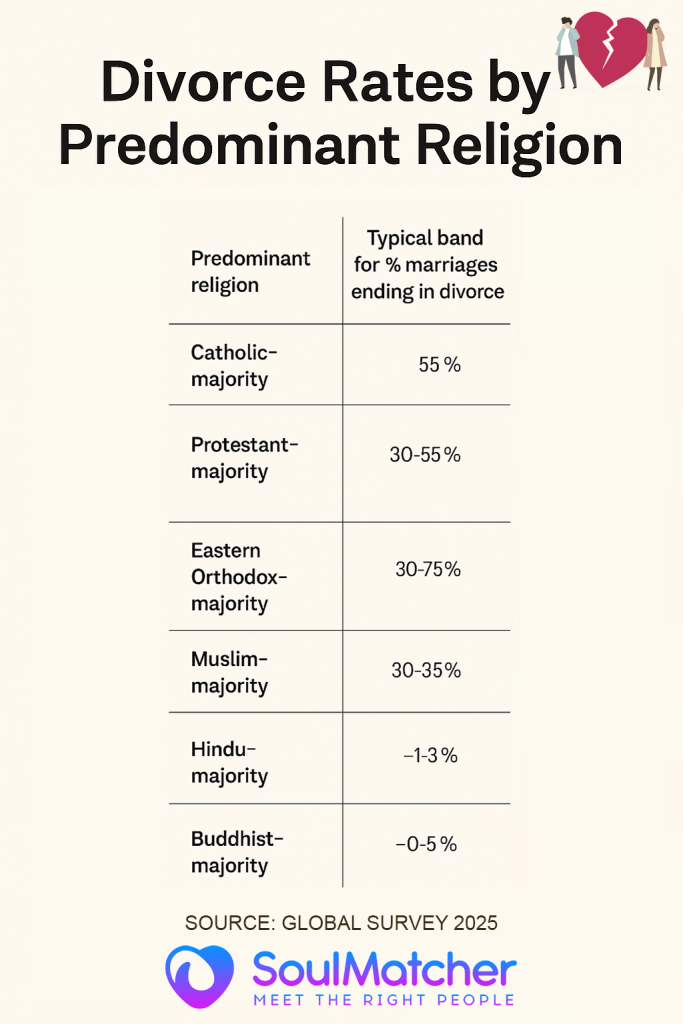
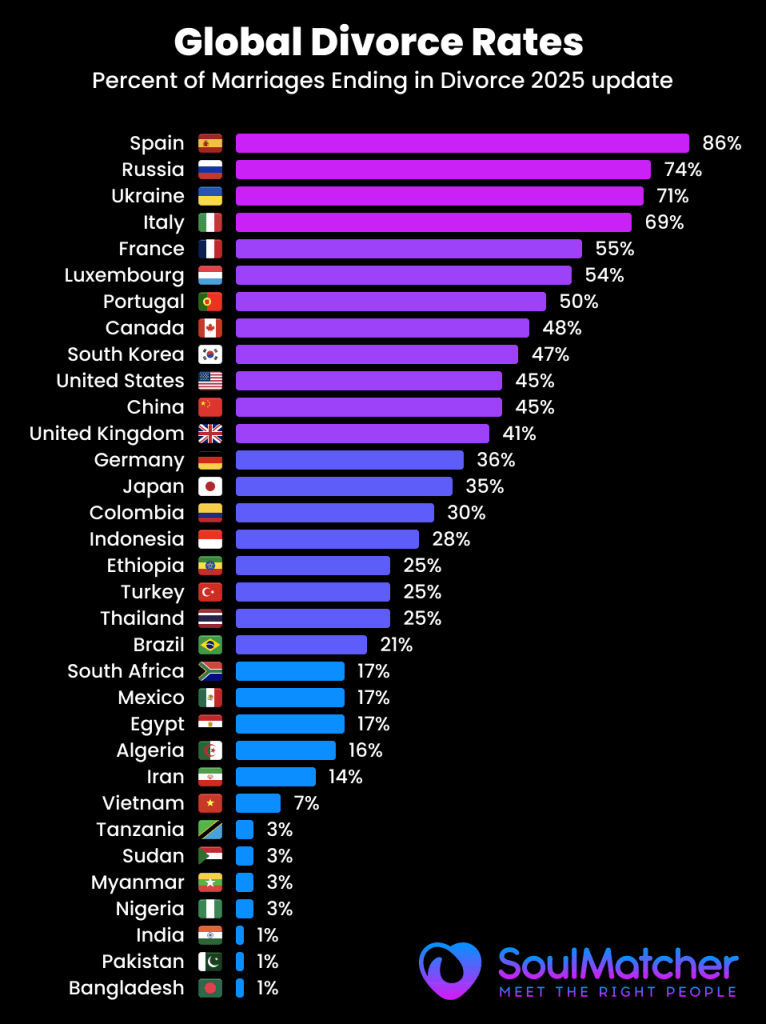
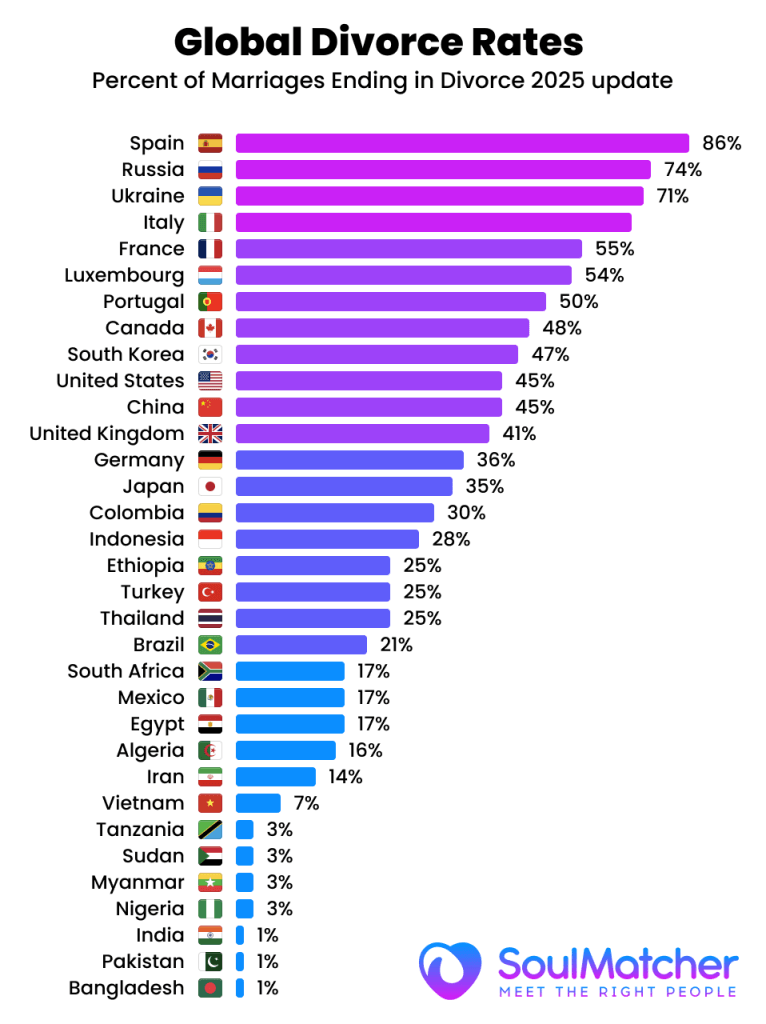
| スペイン | 2020 | 1.6 | 1.9 | 84.2% (世界最高) |
| ロシア | 2020 | 3.9 | 5.3 | 73.6% |
| ウクライナ | 2020 | 2.9 | 4.1 | 70.9% |
| フランス | 2016 | 1.9 | 3.7 | 51.3% |
| ポルトガル | 2023 | 2.0 | 2.8 | 47% |
| スウェーデン | 2018 | 2.5 | 5.0 | 50.0% |
| イタリア | 2018 | 1.5 | 3.2 | 46.9% |
| ドイツ | 2017 | 1.9 | 4.9 | 38.8% |
| イギリス (E&W) | 2015 | 1.8 | 4.4 | 40.9% |
| ポーランド | 2018 | 1.7 | 5.1 | 33.3% |
| ルーマニア | 2018 | 1.6 | 7.4 | 21.6% |
| アイルランド | 2017 | 0.7 | 4.6 | 15.2% |
| マルタ | 2018 | 0.7 | 5.8 | 12.1% |
ヨーロッパだ: スペインが突出している。 離婚に至る結婚の90%世界最高水準である。対照的に、伝統的にカトリックの国々は、つい最近になって離婚を認めた(例えば マルタ(2011年), アイルランド(1996年))は依然として離婚率が非常に低く(1,000人当たり0.8人以下)、離婚率は約 12-15% の結婚が離婚に至っている。西欧の主要国はその中間に位置する。 50% の結婚の割合 フランス 離婚する41% での 英国そして39% で ドイツ.北欧諸国には約 45-50% の結婚が離婚に至っている(例:スウェーデン~50%)。東欧やポスト・ソビエト諸国の多くは離婚率が高い、 ロシア (74%)と ウクライナ (71%)。これらの国では、ソ連時代とその後に離婚が急増した。一方、いくつかの東欧諸国は低い離婚率を維持している(ルーマニアは~22%、伝統的に保守的な規範のため)。全体として、欧州の粗離婚率のほとんどは、以下の範囲にある。 1,000人あたり1~3人中央値は1,000人当たり1.5~2.5人だが、婚姻率が異なるため、離婚対婚姻率は大きく異なる。イタリア(1970年)、スペイン(1981年)、アイルランド(1996年)、マルタ(2011年)で離婚が合法化され、長期的に離婚件数が増加した。
北米
北米の離婚率も比較的高いが、最近の傾向では低下している地域もある。
| 国名 | データ年 | 人口1,000人当たりの離婚件数 | 1,000人当たりの婚姻件数 | 離婚に至る結婚の% |
|---|---|---|---|---|
| 米国 | 2020 | 2.3 | 5.1 | 45.1% |
| カナダ | 2008 | 2.1 | 4.4 | 47.7% |
| キューバ | 2010 | 2.9 | 5.2 | 55.8% |
| メキシコ | 2020 | ~1.0 | ~5.5(推定) | ~2013TP3T(推定) |
| チリ | 2009 | 0.7 | 3.3 | 21.2% |
| グアテマラ | 2019 | (非常に低い) | (高い) | ~5%(推定) |
北米: について 米国 は長い間、主要国の中で最も離婚率が高い国のひとつであった(ピークは1980年代前半の5.0近く)。2000年の米国の離婚率は1,000人当たり4.0であったが、その後低下して現在に至っている。 2.3/1,000人 2020年現在現在 42-45% の結婚が離婚に至ると推定されている。近隣 カナダ もほぼ同様である。 48% の結婚が離婚に至っている(〜2008年現在)。カリブ海地域と中央アメリカ キューバ の離婚率は非常に高い。 56% の結婚が離婚に至っているが、これは離婚が歴史的に容易であったことを反映している。対照的である、 メキシコの粗離婚率(~1.0)はかなり低く、家族の伝統が強いため、推定離婚率はわずか1.5%である。 20-25% の結婚が離婚に至っている(最近のデータに基づく概算)。ラテンアメリカのいくつかの国は、歴史的に離婚率が非常に低かった(最近まで離婚が禁止されていたり、珍しかったりしたためもある)。例えば チリ が離婚を合法化したのは2004年のことで、2009年まではまだ離婚率は低かった(1,000人当たり0.7人、婚姻件数で約21%)。中央アメリカの多くの国(グアテマラ、ホンジュラスなど)では、人口1,000人当たりの離婚率は1以下と報告されており、法的離婚に至る結婚の割合は10%以下ということになる(非公式の別居はもっと高いかもしれないが)。
アジア
アジアは 最も広い範囲 多様な文化や法律を反映して、離婚率も多様である。東アジアやユーラシア大陸の一部の国々は離婚率が最も高く、南アジアは最も低い。
| 国名 | データ年 | 人口1,000人当たりの離婚件数 | 1,000人当たりの婚姻件数 | 離婚に至る結婚の% |
|---|---|---|---|---|
| 中国 | 2018 | 3.2 | 7.2 | 44.4% |
| 韓国 | 2019 | 2.2 | 4.7 | 46.8% |
| 日本 | 2019 | 1.7 | 4.8 | 35.4% |
| イスラエル | 2009 | 1.8 | 6.5 | 27.7% |
| サウジアラビア | 2020 | 2.1 | 5.6 | 37.5% |
| カザフスタン | 2021 | 2.5 | 7.3 | 34.3% |
| トルコ | 2018 | 1.7 | 6.8 | 25.0% |
| ベトナム | 2015 | 0.4 | 5.7 | 7.0% |
| インド | ~2018 | 0.1 | ~10 | ~1%(最低) |
| フィリピン | 該当なし | りこん | - | 0%(法的禁止) |
アジアだ: いくつか イースト・アジアン の国々は急速な社会変化を遂げ、現在では離婚率が高くなっている。 韓国離婚率は1990年代から2000年代にかけて劇的に上昇し、2019年までには約8割に達した。 47% の結婚が離婚に至っている。 中国離婚率も同様に2000年代に上昇し、約8割に達した。 1,000人当たり3.2 (実際、中国の離婚件数は2019年までの16年間、毎年増加している。(2021年に新しい「クーリング・オフ」法が施行され、中国の離婚届出件数は急激に減少したが、これが長続きするのか、それとも単に離婚が遅れるだけなのかは議論されている) 日本 日本の離婚率は2002年頃にピークに達し、その後低下した。 35% の結婚が離婚に至っている。で 東南アジア宗教的・文化的規範の影響もあり、離婚率は中程度から低い傾向にある。例えば ベトナム レポートのみ 1,000人当たりの離婚件数0.4件 そして7% の結婚が離婚に至っている。 インドネシア また、イスラム教徒の人口が多いにもかかわらず、粗離婚率(~1.2)は低い(イスラム教では離婚を認めているが、実際にはまだまれである)。南アジアは世界で最も離婚率が低い。 インドの 離婚率は約 1,000人あたり0.1そして 1%前後のみ の結婚が法的離婚に至っている。この極めて低い割合は、離婚に対する強い社会的烙印、大家族からの圧力、そしてインドにおける法的ハードルに起因している。他の南アジア諸国や中東諸国でも、離婚率は非常に低いと報告されている(例えば スリランカ ~1,000人あたり0.15人、婚姻件数の数パーセント)。一方、中東の一部では より高い 離婚率:例えば、 サウジアラビア そして カザフスタン (イスラム教徒が大多数を占める中央アジアの国)の両者は、次のように見ている。 30-40% の結婚が離婚に至っている。湾岸諸国では、離婚は比較的一般的である。 クウェート 女性はより多くの障壁に直面しているが、男性には寛容な法律によって促進されている。注目すべきは フィリピン (とバチカン)だけが際立っている。 離婚が完全に違法であるところその結果 0% の結婚が法的に離婚に至っている(取り消しは可能だがまれ)。このような法的禁止により、たとえ別居が続いていたとしても、記録上の離婚率はゼロに保たれている。
アフリカ
アフリカにおける信頼できる離婚統計は乏しいが、入手可能なデータによれば、一部の例外を除き、離婚率は概して低い。アフリカの結婚の多くは慣習的または宗教的なものであり、正式な法制度の外で解消されることがあるため、公式な離婚件数は少ない。
| 国名 | データ年 | 人口1,000人当たりの離婚件数 | 1,000人当たりの婚姻件数 | 離婚に至る結婚の% |
|---|---|---|---|---|
| 南アフリカ | 2009 | 0.6 | 3.5 | 17.1% |
| エジプト | 2021 | 2.4 | (推定~9) | ~25%(推定) |
| モーリシャス | 2010 | 1.4 | 8.2 | 17.1% |
| ナイジェリア | ~2016 | (非常に低い) | (高い) | (<5%) (推定) |
| モロッコ/アルジェリア | ~2018 | ~1-1.5 | ~7-8 | ~15-20%(推定) |
アフリカだ: 多くのアフリカ諸国では 離婚率は1000人に1人以下これは、正式な離婚が比較的少ないことを示している。例えば 南アフリカ - よりよく記録されているケースのひとつである。 1,000人当たりの離婚件数0.6件 に相当する。 17% の結婚が離婚に至っている。アフリカの一部では離婚に対する社会的/宗教的な否定が強いこと、裁判に至らないような非公式な別居や一夫多妻制が普及していること、離婚を成立させるのが(特に女性にとって)現実的に困難であることなどが、記録された離婚率の低さの一因となっている。イスラム法が結婚に影響する北アフリカや中東では、離婚は法的に認められているが、条件付きであることが多い。 エジプト例えば、アフリカでは近年、離婚件数が増加しており(2021年には1,000人当たり2.4件)、これはアフリカでも高い離婚率のひとつである。他のアフリカ諸国 モーリシャス (17%)と モロッコ (15-20%)の離婚率は中程度である。一般的に、アフリカの社会は夫婦関係の安定を重視しており、多くの離婚は公的な統計がなくても(例えばコミュニティの長老を介して)起こる。サハラ以南のアフリカの一部では、注目に値する、 組合の不安定性は高い (社会経済的ストレスや寡婦化などの要因による)が、これらは常に「離婚」としてデータに登録されるわけではない。データが存在する場合、多くの場合、都市部や高学歴層の離婚率は農村部よりも高く、これは夫婦の別居の自由度が高いことを反映している。
オセアニア
オセアニアの離婚パターンは欧米諸国と似ている。
| 国名 | データ年 | 人口1,000人当たりの離婚件数 | 1,000人当たりの婚姻件数 | 離婚に至る結婚の% |
|---|---|---|---|---|
| オーストラリア | 2020 | 1.9(推定) | 4.6(推定) | ~41% |
| ニュージーランド | 2020 | 1.5(推定) | 3.6(推定) | ~42% |
| フィジー / 太平洋諸島 | ~2018 | (低い) | (さまざま) | (10-20%) (推定) |
オセアニア オーストラリア そして ニュージーランド 離婚率は欧米並みである。おおよそ 40-45% オーストラリアとニュージーランドでは、結婚生活のうち離婚に至る割合が増加すると予想されている。例えばニュージーランドでは、2022年の粗離婚率は1,000人当たり1.6人であり、同年の既婚夫婦1,000人当たりの離婚件数は約7.6件で、これは約40%の同様の離婚リスクを意味する。両国とも20世紀後半にかけて離婚が増加したが、近年は婚姻率の低下に伴い、離婚率は安定またはわずかに減少している。対照的に、太平洋諸島の多くの小国(フィジー、サモアなど)は、より保守的な家族構成であり、データも限られているが、逸話的証拠によれば、離婚発生率は比較的低い(1,000人に1人以下であることが多い)。
テーブルノート データは入手可能な最新の年(括弧内)を反映。「離婚に至った婚姻数の%」は、その年の離婚数÷婚姻数×100で算出(生涯離婚リスクの高位推定値)。実際の生涯離婚確率は、特に変化の激しい国では若干異なるかもしれない。とはいえ、このパーセンテージは比較指標として有用である。これらの数値については、国連人口統計年鑑や各国の統計機関など、権威ある情報源を引用している。一般的に 世界の離婚率は、1,000人当たり0.5人以下(少数の離婚率の低い社会)から、離婚率の高い国では1,000人当たり3~4人程度まで幅がある。一方、離婚に至る結婚の割合は5%未満から90%以上と、法律的・文化的な両極端を反映した驚くべき幅がある。
世界で最も高い離婚率と最も低い離婚率
世界的には 最も高い粗離婚率 (人口1,000人当たり)は、ソビエト連邦崩壊後の国家、ヨーロッパの一部、その他いくつかの地域で観測されている。国連の最新データによると、年間離婚率の上位は以下の通りである:
- 北マケドニア 人口1,000人当たりの離婚件数9.6件 (2023年) - 最近の急増により、このバルカンの小国がトップとなった。 (2023年のこの異常に高い割合は、パンデミック後に処理された離婚の滞留やその他の異常によるものかもしれない)。
- モルディブ 5.5/1,000人 (2020年) - 歴史的にモルディブの離婚率は非常に高く(2002年には1000人あたり10.97件となり、ギネス世界記録に認定された)、これは多重結婚という文化的規範に起因している。近年でも人口1,000人あたり5件以上の離婚があり、世界のトップである。
- ベラルーシ、グルジア、モルドバ: 周辺 3.7~3.8/1,000人 (2021-2022).旧ソビエト連邦のいくつかの共和国が上位にランクインしているが、これはソビエト連邦崩壊後の社会的離婚容認率の高さと経済的ストレスを反映している。例えば、ベラルーシは1,000人当たり3.7人、モルドバは3.7人である。
- ラトビア、リトアニア ~2.5~2.9/1,000人 (2022).バルト三国の離婚率は常に高く、ラトビアは現在EUで最も高い2.8%である。
- アメリカ ~1,000人につき2.3人 (2020年)-かつて米国はトップクラスだったが、その割合は低下し、現在では東欧と比較して緩やかなものとなっている。
という点では 「生涯」離婚リスク(離婚に至る結婚の割合)離婚率の高い国は、以下の通りである。離婚率の高い国は以下の通り:
- スペイン ~85% の結婚が離婚に至っている。1981年に離婚が合法化された後、スペインの離婚率は急上昇し、新婚が比較的少ないこともあり、最近のデータでは離婚率は極めて高い。
- ロシア 73-74%; ウクライナ ~71%; ベラルーシ ~60-65% (推定)。これらのスラブ諸国は結婚回転率が高く、結婚件数は多いが、その割に離婚件数が多い。
- キューバ ~56%; フランスだ: ~51%; スウェーデン 50%.多くの欧米諸国は50%の水準にあり、これは結婚のおよそ半分が最終的に解消することを意味する(よく言われる「結婚の半分が離婚に至る」というのは、アメリカ、フランス、イギリスなどではだいたいその通りである)。
それに対して 最低離婚率 は、離婚に法的または文化的な障壁がある社会で見られる。以下のようなものがある:
- インドだ: くらいしかない。 1% の結婚が離婚に至っている。インドの粗離婚率(~0.1)は、どこの国よりも低い。強いスティグマと結婚に耐えることへの期待から、離婚はほとんどない。
- ブータン、スリランカ、ベトナム: のみ 5-7% の結婚が離婚に至っている。これらのアジア諸国の離婚率は、1,000人あたり0.5件を大きく下回っている。例えばスリランカでは0.15であり、離婚には長期の法的手続きを要することが多い。
- コロンビアと多くのアフリカ諸国だ: しばしば 10-20% 離婚の可能性カトリックや共同体の影響が強いアフリカやラテンアメリカの多くの国(グアテマラ、コンゴ、ナイジェリアなど)では、離婚件数が非常に少ないと報告されている。
- フィリピンとバチカン市国: 0% (法的離婚はできない)。フィリピンでは、結婚を解消できるのは婚約破棄か死亡のみである。当然のことながら、公式な離婚率は事実上ゼロであり、世界の離婚ランキングではしばしば最下位に位置している。
図:離婚率の世界地図(国別の「離婚する確率」)。暖色系(赤)は離婚率または離婚の可能性が高いことを示し、寒色系(緑)は離婚率が低いことを示す。灰色はデータ不足を示す。この地図は、離婚が旧ソ連、ヨーロッパの一部、北米で最も多く、南アジア、アフリカの一部、東南アジアの一部の国で最も少ないことを強調している。
地図とデータが示すとおりだ、 離婚率は地域によって大きく異なる.一般的に、先進地域やよりリベラルな社会規範を持つ地域(ヨーロッパ、北米、オセアニア)の離婚率は高く、より伝統的または制限的な規範を持つ発展途上地域(南アジア、中東、アフリカ)の離婚率は低い。しかし、特筆すべき例外もある。例えば、裕福な東アジア諸国(日本、韓国)の離婚率は中程度であり、(旧ソビエト圏のような)貧しい国の中には、独自の歴史的要因により離婚率が高い国もある。次に述べるように、文化的態度、宗教、法体系がこれらの結果に大きく影響している。
主要国の過去の離婚傾向
多くの国で離婚率が上昇傾向にある。 逆U字型 1970年代から1990年代にかけて急激に上昇し、2000年代には停滞または減少している。ピークの時期と高さは国によって異なり、さまざまな社会変化を反映している。下の図1は、世界各国の離婚率の推移を示したもので、こうした多様なパターンを浮き彫りにしている。
図1:特定国の離婚率の推移(人口1,000人当たりの年間離婚件数)(1960-2020年)。多くの欧米諸国(例 米国, イギリス, ノルウェー)の離婚率は1960年代から上昇し、1970年代から1980年代にかけてピークを迎え、その後低下した。東アジアや東欧の一部の国(韓国, エストニア, ポーランド)は、離婚がより受け入れられるようになった後(2000年代初め頃)にピークを迎えた。その他 トルコ は、低水準から2010年代にかけて着実に上昇している。(データソース:OECD/UN, via Our World in Data.)
の中で 米国1960年に2.2であった粗離婚率は、無過失離婚法の導入と性別役割分担の変化に伴い、1981年には1,000人当たり5.3と過去最高を記録した。それ以来、離婚率は着実に低下し、2021年には過去50年間で最低の2.5まで低下した。この減少の一因は、若い世代がより遅く、より選択的に結婚し、より安定した結婚生活を送るようになったことにある。米国の初婚の離婚リスクはいくらか低下している(現在、全体で約40~45%と推定されている)。同様である、 カナダ そして オーストラリア は1980年代にピークを迎え、その後は減少している。例えば、オーストラリアの離婚率は、1975年に無過失離婚が始まった後に急上昇し、その後安定した。 ダウン 1980年代には約50%であったが、現在では約41%である。
で 西ヨーロッパほとんどの国では、1970年から1990年にかけて離婚率が急上昇した。離婚率は 英国 離婚件数は1990年代半ばの1,000人当たり3件(1990年代の改革による離婚件数の減少)をピークに減少し、現在は1.8件となっている。 スカンジナビア 例えば、スウェーデンは1980年代までに1,000人当たり2.5人に達し、現在も2.0~2.5人程度である。 南ヨーロッパ イタリア、スペイン、ポルトガルのような国々は、離婚が合法化されるまで離婚率が非常に低かった(スペイン1981年、ポルトガル1975年、イタリア1970年)。合法化後、これらの国では離婚率が急上昇した:スペインの離婚率は、特に2005年に制定された法律で手続きが緩和された後に急上昇し、現在の高い離婚率の一因となっている。ポルトガルの離婚率も1990年代から2000年代にかけて急上昇した。興味深いことに、欧米諸国では最近 辞退 離婚率:例 ドイツ、オランダ、フランス はいずれも、2000年代初頭から粗離婚率がわずかに低下している。これは、そもそも結婚する人が減った(そのため離婚できる人が減った)ことに加え、同棲が増え、結婚年齢が高くなった(そのため離婚リスクが低くなった)ことが原因であると考えられている。離婚率 EU全体 離婚率は2006年ごろの2.1%をピークに減少し、2019年には1.8~2.0%となった。
で 東欧と旧ソ連1990年代の移行期は離婚率が非常に高かった。 ロシア そして ウクライナ ソビエト連邦崩壊後の社会的混乱と新たな自由を反映して、1990年代から2000年代にかけての粗婚姻率は1,000人当たり4~5人前後でピークを迎えた。その後、ロシアの出生率は約3.9(2020年時点)まで緩やかになったが、婚姻件数と比較すると依然として高い。バルト三国(エストニア、ラトビア、リトアニア)はいずれも1990年代後半に離婚率が急上昇し、高止まりしている(ラトビアの2023年の離婚率2.8は欧州で最も高い水準)。東欧諸国の中には、最近になって離婚傾向が低下している国もある(例:ラトビア、リトアニア)。 ポーランド 2006年頃をピークに、その後わずかに減少した)。おそらく、家族を重視する文化や、若年層の結婚数の減少が原因であろう(ポーランドは依然として、欧州で最も結婚率の高い国のひとつである)。
アジアの トレンドは多岐にわたる。 日本の 離婚率は第二次世界大戦後徐々に上昇し、2002年には約2.1に達したが、人口の高齢化と結婚する若者の減少に伴い、2019年には約1.6~1.7まで低下した。 韓国 離婚率は1990年の1.1%から2003年には3.5%まで3倍に上昇し、2010年には2.2%まで低下した。韓国と日本のこのパターン(ピークとその後の減少)は、世代交代(1980年代から90年代に結婚したコーホートは離婚率が高かったが、若いコーホートは結婚が減り、少し安定している)によって一部説明できる。 中国 1980年代の非常に低いベースから、中国の粗離婚率は2018年までに3.2に達した。中国政府が最近、2021年に30日間の離婚待機期間を導入したことで、その直後から登録離婚件数が70%減少したと報告されているが、これは真の行動変化というよりは、別居の遅れや未登録を示すものかもしれない(離婚を急ぐ中国人夫婦もいる)。 以前 2021年には減少している)。長期的に見れば、中国の傾向は、都市部における個人主義の高まりと離婚にまつわるスティグマの減少を反映している。中国 インドこれとは対照的に、離婚率は長期にわたって一貫して極小のままである。これに匹敵するような「離婚ブーム」はなく、歴史的なスティグマ(汚名)が離婚率をゼロに近い状態に保ってきた(ただし、インドの都市部では近年、離婚が徐々に増加している)。
多数 中東 そして 北アフリカ のように)長期的なデータがない国もある。 エジプト そして ヨルダン)は、緩やかな社会変化と法改正が原因と思われる2010年代の離婚件数の上昇を示している。例えば、エジプトの離婚率は2010年代を通じて上昇し、2021年には最高を記録した(1,000人当たり2.4人)。 湾岸諸国 UAE、カタール、クウェートなどでは、1990年代から2000年代にかけて離婚率が高く(カタールのピークは2005年ごろで、1,000人あたり約2.2人、クウェートはさらに高い)、その後、安定化したと報告されている。このような傾向は、近代化や女性の教育水準の向上が、不幸な結婚に終止符を打つ意欲を高めることにつながっていることが多い。
で アフリカ過去のデータは限られている。しかし、逸話的証拠によれば、南部アフリカ諸国の中には、2000年以降に離婚が一般的になった国もある(例. ボツワナ そして 南アフリカ は1990年代に増加し、その後わずかに減少した)。南アフリカの離婚記録は2004年以降徐々に減少しているが、これはおそらく正式な結婚が減り、同棲が増えたためであろう。対照的に エチオピア または ナイジェリア 別居率はもっと高いかもしれないが、正式な離婚率は歴史的に見ても非常に低い。
要約すると、主要先進国は「離婚革命」のピークをほぼ過ぎた。20世紀後半にかけて上昇した離婚率は、21世紀には頭打ちか減少に転じている。発展途上国にはさまざまな段階がある。2000年代に離婚率の急上昇を経験し、現在は横ばいになっている国(特に東アジア、ラテンアメリカの一部)もあれば、永続的な文化的制約のために大幅な上昇に至っていない国(南アジア、アフリカの一部)もある。
地域と経済パターン
を比較する場合 大陸と経済グループ離婚率には明確なパターンがある:
- ヨーロッパと北米: これらの高所得地域は 中〜高離婚率.OECD高所得国の平均粗離婚率は以下の通りである。 1,000人につき1.8人 である。ヨーロッパ内では、EUの平均は~2.0である。ほぼすべての欧米諸国は無過失離婚を認めており、法的障壁も最小限であるため、離婚水準はかなり高い。しかし、このグループ内でもばらつきがある:北欧・西欧(および北米・オセアニア)の離婚率は40~50%前後であるのに対し、伝統的にカトリックや正教の国(アイルランド、ポーランド、イタリア)は上昇傾向にあるものの、低い。 経済発展と都市化 これは、女性の経済的自立と社会的セーフティネットが、結婚からの離脱をより現実的なものにしているからである。実際、女性の教育や労働力参加が進んでいる国ほど離婚率が高いという研究結果もある。これは、例えばスカンジナビア(男女平等が高く、離婚率が相対的に高い)対後進国で明らかである。同時に、離婚率が極端に高いことは、次のようなことを反映している可能性もある。 社会的混乱 - 例えば、ロシアとその近隣諸国(高位中所得国)は、社会経済的緊張と政策に対する宗教的影響力の弱さにより、離婚率において多くの富裕国を上回っている。
- アジアだ: アジアは一般化を拒んでいる。 最低 そして 最高 離婚社会。一般的に 東アジア・中央アジア 韓国、中国、カザフスタンなど)の離婚率は、今や欧米諸国並みである。対照的だ、 南アジア(インド、バングラデシュ、パキスタン) は、文化的規範(家父長的家族制度、スティグマ、見合い結婚の伝統)のため、離婚が極めて少ない。 東南アジア インドネシアやマレーシアのようなイスラム教徒が多い国では、離婚の記録は少ないが、イスラム法は男性の離婚を比較的容易に認めている(そのため、非正規離婚が増える可能性がある)。これらの地域では、家族の結束と離婚にまつわる社会的羞恥心が離婚率を抑えている。例えば ベトナム そして タイ が低いのは、拡大家族が夫婦間の問題を調停することが多いためでもある。 経済的要因 アジアの貧しい農耕社会では離婚が少ないが、これは家族が経済単位であり、女性が結婚以外のサポートに欠ける可能性があるためである。しかし、経済が成長し、女性が機会を得るにつれ、離婚は増加する傾向にある(例えば、中国の都市部における離婚の急増は、経済の自由化と同時期であった)。注目すべきは、(これまでのフィリピンのように)離婚法が制限的であったり、別居の要件が長かったりする国は、当然ながら離婚率が低いということである。
- 中東と北アフリカ この地域の離婚率は中程度であるが、ばらつきが大きい。一般に、湾岸アラブ諸国(クウェート、カタール、UAEなど)や北アフリカ諸国では、1,000人当たり1~2件程度と報告されており、ヨーロッパほどではないが、南アジアよりは高い。文化的規範は、女性が離婚を切り出すことを強く禁じているが、(イスラム法では)男性が妻を否認することができるため、男性が切り出す離婚率が高くなる可能性がある。 ジェンダー不平等 皮肉なことに、ジェンダー不平等が高い中東諸国には また の離婚率は比較的高い(男性は自由に離婚できるが、女性はその結果に耐えるため)。逆に、イエメンやシリアのように離婚率が非常に低いところは、社会的圧力と、女性が離婚をすることの難しさの両方を反映しているのかもしれない。近年、法改正によって離婚が容易になり、女性の教育水準が向上したため、近代化によって、よりリベラルな地域(チュニジア、イラン、トルコなど)では離婚がわずかに増加している。例えば、トルコの離婚率は1,000人当たり1.7件に過ぎないが、伝統的な家族構造が進化するにつれて上昇の一途をたどっている。
- ラテンアメリカ ラテンアメリカ諸国は歴史的にカトリックの影響で離婚率が低かった(20世紀後半まで離婚を禁止していた国も多かった)。過去数十年の間に ラテンアメリカでは離婚が合法化され、一般的になっている。ほとんどのラテン諸国の粗離婚率は1,000人当たり1~2人程度である(例:ブラジル~1.4人、コロンビア~0.7人、コスタリカ2.6人)。 キューバ キューバ革命以来の世俗的で社会的に自由な政策に起因することが多い。ドミニカ共和国とプエルトリコも1,000人当たり2.4~2.6人と比較的高い。一方、以下のような文化的に保守的な国々は、離婚率が高い。 チリ そして ペルー が低いままである(チリの離婚率が1,000人当たり1.0人を超えたのは、離婚が合法化された2010年代に入ってからである)。全体として、ラテンアメリカが都市化し、女性の権利が向上するにつれて、離婚率は徐々に上昇しているが、家族中心の文化によって、離婚率は欧米の水準を下回っている。重要なのは インフォーマルセパレーション 多くのカップルが法的な離婚をせずに別れるか、そもそも正式な結婚をしていないため、公式の数字には反映されない。
- アフリカだ: アフリカは最もデータが少ない地域だが、伝統的な規範は夫婦関係の安定を支持している。多くのアフリカ諸国は二重の婚姻制度(民法と慣習法)を持っており、慣習法による離婚は公式にはカウントされていない可能性がある。データがある場合(南アフリカ、エジプト、モーリシャス、ケニア)、粗率はおおよそ以下の範囲にある。 0.5から2.0.一般的に、 サブサハラ・アフリカ は低い離婚率を記録している。例えば、ナイジェリアとエチオピアの離婚率は極めて低い。例外は ボツワナ1990年代のアフリカの離婚率は異常に高かったが(母系社会構造のためか、結婚の10%以上が離婚に至る)、データは限られている。アフリカの社会では、花嫁の値段(持参金)やコミュニティの調停といった要素が離婚を抑制している。しかし、一夫多妻制や非婚同棲は、"離婚 "として捕らえられない関係解消につながる可能性がある。注目すべきは、アフリカで女性の識字率や雇用が高い国(南アフリカ、モーリシャスなど)は、女性の自主性が低い国よりも離婚率がやや高い傾向があることだ。それでも、南アフリカでさえ、離婚率は欧米諸国と比べれば控えめである。 経済的ストレス 結婚によって家族がバラバラになることもあれば、結婚が経済的に必要なパートナーシップとなり、人々がそこから離れたがらないこともある。
からの 経済分類 という視点だ、 高所得経済 の方が離婚率が高い。 低所得経済.先進国は公的な離婚率が高いだけでなく、より自由な法律や離婚した人を支援する社会的なセーフティネットがある。対照的に、低所得国では、結婚はしばしば家族の名誉、女性の経済的安定、社会的地位と結びついており、離婚を抑制している。例えば、離婚率の低い上位10カ国はすべて、国連のジェンダー不平等指数(女性の役割がより伝統的で制限的であることを示す)のスコアが低い。これは以下のことを示唆している。 離婚率が非常に低いのは、夫婦円満というよりも、女性のエンパワーメントが限られているか、法的なハードルが高いことの表れかもしれない.実際、比較してみると、離婚率の低い国の多く(ウズベキスタン、モンゴル、パキスタンなど)は男女平等の順位が低いのに対し、離婚率の高い国の中には、比較的男女平等な国(スウェーデン、ベルギーなど)もあるが、そうでない国(ロシア、ベラルーシ)もある。要するに 個人の自由と男女平等の拡大は、離婚率をある程度まで高める傾向がある。しかし、極めて高い離婚率は、中所得国における社会的不安定や規範の進化に起因することもある。離婚率の高い社会にはさまざまな経済レベルがあるが、共通しているのは、結婚を終わらせることを文化的に受け入れていることである。逆に、離婚率の低い社会では、離婚にまつわる厳しい法的/宗教的制約や社会的罰則を強いていることが多い。
社会的、法的、文化的背景
離婚は真空地帯で発生するものではなく、社会の規範、法律、結婚に対する考え方に深く影響される。ここでは、社会的、法律的、文化的な要因が離婚率の違いにどのような影響を与えているかを検証する:
- 文化的/宗教的規範: おそらく離婚率を最も強く左右するのは、結婚の永続性に対する文化的態度であろう。結婚が神聖で不溶の結合とみなされている社会(多くの場合、宗教に支えられている)では、離婚はまれである。例えば インド イスラム教徒が大多数を占める多くの国々では、離婚にはかなりの汚名がつきまとう。家族は恥を避けるために、たとえ不幸な状況や虐待的な状況であっても、夫婦が一緒にいるよう圧力をかけることがある。インドでは、結婚の概念はしばしば「一生もの」であり、離婚は社会的スティグマとなりうるため、結婚のうち1%しか破綻しない。同様に、カトリック教徒が多い国では、歴史的に(例えば フィリピン, アイルランド, ポーランド)、離婚に反対する宗教的教義により、法改正が行われるまで離婚率は極めて低く保たれていた。対照的に、個人の幸福や個人的な充足感を重視する文化圏では、離婚率が高くなる傾向がある。今日のヨーロッパと北米の多くでは、離婚は残念なことではあるが、社会的に受け入れられ、かなり一般的である。この受容は世俗化によって1960年代以降に著しく拡大した。例えば 西ヨーロッパ は、離婚件数が多いことに対応している。 スペイン 20世紀後半にカトリックの独裁政権から世俗的な民主主義へと移行したことで、離婚件数は結婚件数の85%まで急増した)。 儒教の影響を受けた東アジア諸国 (中国、韓国、日本)は伝統的に家族の結束を重んじ、離婚が少なかったが、これらの社会が近代化し、個人主義的になるにつれ、離婚はタブー視されなくなった。国内でも、宗教的なコミュニティや農村部よりも、都市部の世俗的なコミュニティで離婚が多いことは注目に値する。例えば 米国福音主義的なキリスト教社会では、宗教的に離婚が奨励されているため、離婚率が全国平均よりやや低いことが多いが、リベラルな社会では離婚率が高い。
- 法的アクセスと改革: 離婚のしやすさ、しにくさは重要な要素である。離婚が 違法または厳しく制限されている金利は当然極めて低い。私たちは フィリピンとバチカン市国離婚が認められていない国の離婚率はゼロである。長い別居期間、特定の理由(過失による離婚)、または双方の同意が必要な国では、離婚率は一般的に、すぐに無過失で離婚できる国よりも低い。例えば マルタ 2011年に離婚を合法化した際、当初は4年間の別居が必要だったため、離婚率は低く抑えられていた。 アイルランド にはまだ離職期間があり(最近4年から2年に短縮された)、これがその低い離職率(~15%)の一因となっている。対照的に 無過失、迅速な離婚手続き が高い傾向にある。アメリカ(1970年代)やオーストラリア(1975年)などで無過失離婚法が導入されると、夫婦が不義を証明する必要がなくなったため、離婚申請が一気に急増した。今日、ほとんどの欧米諸国では、理由なく双方の合意による離婚が認められており、離婚件数の増加が常態化している。手続きを簡略化している国さえある(例えば ノルウェー そして スウェーデン は短期間の待機期間の後、オンライン申請を許可している)。比較分析によると、離婚手続きが最も簡単で負担の少ない国は以下の通りである。 ノルウェー、スウェーデン、スペイン、メキシコ、スロベニア、アルゼンチンこれらの国の離婚率は、予想通り中程度から高い。逆に、離婚に関する法律が非常に複雑な国もある、 パキスタン (女性は裁判を起こして根拠を証明しなければならないが、男性は一方的に否認できる)あるいは エジプト (女性が経済的権利を放棄して無過失「クーラ」離婚をする場合)、離婚件数は減少するか、男性優位の離婚申請が増える。法改正は直ちに統計に影響を与える: チリ 2004年まで、合法的な離婚はゼロに等しかったが、合法化された後、需要が高まり、何千もの離婚が登録され、離婚率が上昇した。 ブラジル 2010年に離職期間を撤廃した後、増加した。2010年 中国しかし、最近の冷却期間法は、離婚プロセスに摩擦を加えることで、離婚件数を一時的に抑制しているように見える。このように、法制度がいかに離婚しやすいか、あるいは離婚しにくいかが大きな役割を果たしている。
- 女性の権利と経済的自立: 一貫して言えることは 女性が社会経済的な力を得るにつれて離婚率が上昇.女性が教育を受け、キャリアを持ち、法的権利を持つようになれば、不幸な結婚や抑圧的な結婚に耐える可能性は低くなる。歴史的に、女性が財産を所有することも自活することもできなかった社会では、離婚は女性を貧困や社会的追放に陥れることが多かったため、離婚はまれだった。こうした障壁が取り除かれるにつれ、離婚は増加した。例えば、1970年代に欧米諸国で離婚が急増したのは、女性解放運動が起こり、より多くの女性が働くようになったことと相関している(その結果、離婚は増加した)。 米国 東アジアでは、1990年から2000年にかけて離婚が増加したが、これは女性の教育と労働参加が拡大したことと同時期であった。)東アジアでは、1990年代から2000年代にかけて離婚が増加し、女性の教育と労働参加が拡大した。 韓国、中国、台湾など。中東では、女性の識字率が高い国々(例えば イラン, トルコ離婚率の低いイエメンなど)よりも高い。ジェンダーの側面は明らかである、 離婚を切り出すのは男性より女性の方が多い 例えば、米国では離婚のおよそ70%が女性によって申し立てられており、これは他の先進国でも見られるパターンであるが、これは女性が自立するにつれて、不満足な結婚生活に終止符を打つことに積極的になっていることを示唆している。一方、アラブ世界の一部のように、(法律や規範により)離婚の大部分が男性主導で行われる地域では、離婚は異なる社会的意味を持つかもしれない(離婚率が高いということは、男性が頻繁に離婚し再婚していることを示す場合もある)。全体として、法的権利の改善(夫婦財産法や養育費の執行など)や社会的支援(離婚した女性に対するスティグマの軽減など)は、現実的な障壁を取り除くことで、離婚率の向上に寄与する。
- 経済的ストレスと都市化: 直感に反するが、繁栄も貧困も離婚にさまざまな影響を与える。経済的な安定は離婚を促進する。同時に 経済的ストレス (失業、インフレ)は、結婚生活を緊張させ、破綻に導く可能性がある。例えば、ソビエト連邦崩壊後、経済的混乱が夫婦関係の不安定さにつながった可能性が高く、ロシアの離婚率は1990年代の経済危機で急上昇した。ギリシャでは、最近の金融危機で離婚が増加したと言われている。一方、不況は一時的に夫婦関係を不安定にすることもある。 下げる 夫婦が費用のかかる法的手続きを遅らせたり、世帯を分離する余裕がなければ、離婚率は低下する。これは2008年の世界同時不況の際にも見られたことで、離婚率がわずかに低下した国もある。 都市化 都市では伝統的な家族の監視が弱く、人々はより多様なライフスタイル(と誘惑)にさらされる。また、都市は離婚した人々にとってより匿名性が高く、支援ネットワークもある。例えば、中国の離婚率が最も高いのは上海や北京のような大都市であるのに対し、農村の離婚率ははるかに低い。
- 社会的期待の変化: 現代の結婚には、伝統的な功利主義的結婚とは異なる期待(感情的充足、役割分担)があることが多い。期待が高まるにつれ、不満足な結婚生活に対する許容度が下がり、離婚が増えると主張する学者もいる。愛と自己実現に基づく結婚へのシフトは、そのようなニーズが満たされない場合、離婚の増加につながる可能性がある。世界の若い世代は一般的に、離婚に対する考え方が親よりもリベラルである。A 国連グローバル概要 法的な変化だけでなく、不幸な結婚にとどまる必要はないという社会的受容も反映している。さらに、アジアのような地域では、お見合い結婚の減少と恋愛結婚の増加が逆説的に離婚を増加させる可能性がある。恋愛に基づいてパートナーを選ぶ場合、愛が薄れれば別れを選ぶかもしれないが、お見合い結婚の場合は、持続させるために家族からのプレッシャーが強くなる。
- 同棲の効果: 多くの欧米諸国では 同棲 が離婚統計に影響を与えている。同棲は「お試し婚」や結婚の代替としての役割を果たすこともある。国によっては(例えば スウェーデン、フランス)、多くのカップルが結婚することなく同棲し、子供さえもうけている。こうしたカップルの中には、離婚統計に載ることなく破局するものもある。同棲は婚姻率の低下に寄与しており、その結果、粗離婚率も低下している(そもそも結婚する人が少ないのだから)。同棲は、結婚前の弱い関係を淘汰し(より安定した結婚につながる)、あるいは、結婚して離婚したはずの人々が単に同棲して別れるという変化を反映しているかもしれない。全体として、ヨーロッパとアメリカにおける同棲の増加は、離婚率が最近横ばいか低下している理由のひとつである。
- 政策とサポートシステム: 離婚に影響を与える政策を積極的に実施している政府もある。例えば 強制カウンセリングまたは調停 (スウェーデンやアメリカのいくつかの州のように)衝動的な離婚を減らすかもしれない。逆に、片親を支援する福祉政策は、離婚をより現実的なものにする可能性がある。 親権と扶養に関する法律 法律が子どもや収入の少ない配偶者を養うことを保証していれば、配偶者は離婚する自由を感じるかもしれない。そのような支援がない国では、親(特に母親)は子どものために結婚生活を続けるかもしれない。国家がセーフティネットを提供している国ほど離婚率が高いというデータもある(例えば、北欧の手厚い福祉は離婚率の高さと一致している。)いくつかの国(特に マレーシア、インドネシアCOVID-19パンデミックは、政策と状況が相互に作用した最近の例である。COVID-19の大流行は、政策と状況が相互に作用した最近の例である。 ドロップ 2020年の離婚件数は世界的に減少した(裁判所は閉鎖され、夫婦は別れを延期した)。しかし、一部の地域では、その後、溜め込んでいた需要が解放されたため、離婚件数が回復した(例えば、以下の通り)。 ラトビアの 離婚率は2020年の落ち込みの後、2021-22年に急上昇した)。
要約すると 社会的背景が重要 離婚率を理解するために離婚率の高い社会は一般的に、世俗的な態度、利用しやすい法的手続き、男女平等の拡大、個人の選択の重視を特徴とする。離婚率の低い社会は、宗教的あるいは氏族的な統制が強く、法的な障害があり、(特に女性にとって)離婚に対する社会的あるいは経済的な罰則が大きいことが多い。低離婚国の人々が夫婦関係の破綻や衝突を経験しないわけではなく、むしろ結婚生活を維持しなければならないというプレッシャー(あるいは離婚するための仕組みの欠如)が、結婚生活を書類上そのまま維持しているのである。一方、離婚率の高い国では、結婚生活に不満がある場合、結婚を解消するための支援制度や社会的受容があることが多い。ある調査概要はこう述べている、 「一般的に、女性の教育水準が高い国ほど離婚率が高い。 社会科学者たちはまた、離婚に対する態度は離婚率に影響し、また影響されるとも指摘している。社会で離婚が一般的になればなるほど、離婚はさらにスティグマを失い、正常化のフィードバックループが生まれる。
結論と要点
世界中の離婚率は、文化的価値観、法的枠組み、経済状況、社会変動が複雑に絡み合っていることを反映している。少数の 主な調査結果 この包括的な概要には以下のようなものがある:
- 世界的なトレンド: 20世紀後半は欧米諸国を中心に世界的に離婚率が上昇したが、21世紀に入ってその傾向は二極化している。2000年以降、多くの高所得国では離婚が安定または減少しているが、一部の中所得国では依然として増加傾向にある。2020年代の時点で、世界の平均粗離婚率はおよそ 1,000人につき1-2人しかし、この平均値は大きなばらつきを隠している。
- 最高料金: 離婚率が高い国は、次のような傾向がある。 東欧(旧ソビエト)の一部である。 西ヨーロッパそして、いくつかの 新世界 の国々。離婚に至る結婚の割合で測定、 スペイン(~85%) のような国々が続く。 ロシア(~74%)ベルギー(~70%)*、および キューバ(~56%).これらの地域は、婚姻率が非常に低いか、離婚に非常に寛容な地域である。年間粗婚率で見ると、上位は以下の通りである。 モルディブ, カザフスタン/ベラルーシ/グルジア (~3.5-3.8)、そして最近では異常値である 北マケドニア.一般的に、離婚率が1,000人当たり3件を超えると、今日の状況では離婚率が高いと見なされる。離婚率の高い国は、社会の急速な自由化や経済の激変により、伝統的な家族の絆が緩んでいることが多い。
- 最低料金: 極端な話だ、 南アジアと西アフリカ諸国 離婚率が最も低い。 インドの~1% 離婚率の高さは、夫婦の永続規範が強いことを象徴している。離婚率が非常に低い国(婚姻件数1,000件あたり0.5件未満、または10%未満)には、以下のような国がある。 ブータン、スリランカ、ベトナム、グアテマラ、ペルー、アフリカの一部の国.このような場所の多くでは、離婚は社会的に、時には法的に奨励されていない。さらに、いくつかの州では 離婚禁止 (フィリピン、バチカン)、事実上ゼロ金利を維持した。
- 地域差: ヨーロッパ は、東(バルト、スラブ諸国での離婚が非常に多い)、西/北(多いが若干減少、一部減少あり)、南(中程度、低いベースから上昇)に分かれている。 北米/オセアニア は比較的均質で、中程度の離婚が多い(結婚の40-50%)。 ラテンアメリカ 離婚は一般的に中程度から低レベルだが、合法化後は上昇傾向にある。 アジア 東アジアは高いが、南アジアは低く、東南アジアは中程度である。 アフリカ は、数カ国が高くなってきている以外は、ほとんど低い。このような違いは、各地域の優勢な宗教や文化的歴史、開発水準と一致することが多い。
- 歴史的な転換: 主要国では、20世紀後半に離婚が非常に多くなったが、「離婚ブーム」は減速している。例えば、アメリカや多くのヨーロッパ諸国では、衝動的に結婚する人が減り、結婚の質に対する期待が高まるにつれて、離婚率がピーク時から低下している。専門家の中には、結婚する人がより意図的に結婚するようになり、より長続きする結婚につながる可能性がある(いくつかのデータでミレニアル世代の離婚率が低下していることに見られるように)。同時に、世界の他の地域(アジアの一部や中東など)では、以下のような傾向が見られる。 入場 近代化が進むにつれて離婚が増加する時期である。
- 社会的背景: 離婚率の高さは、本質的に「良い」「悪い」というわけではない。個人の自由や男女平等の拡大(人々は悪い結婚から抜け出すことができる)を示すこともあるが、社会的ストレスや支援ネットワークの弱体化を反映することもある。離婚率の低さは、安定した家庭と強いコミットメントを示すこともあるが、結婚に耐えられない人々の選択肢の少なさを示すこともある。例えば、離婚率が非常に低い社会では、非正規の別居が多かったり、代替手段がないために虐待に耐えている女性がいたりする。そのため、離婚統計を理解するには、数字だけでなく、その背景を探る必要がある。 社会的織物例えば、スウェーデンでは離婚率が高くても生活満足度が高く男女平等であるのに対し、アフガニスタンでは離婚率が低くても女性の自律性が低い。
- COVID-19の影響: 簡単なメモ - COVID-19の大流行は当初、2020年に離婚件数の減少を引き起こした(裁判所が閉鎖され、夫婦の決断が遅れたため)。その後、2021年から2022年にかけて回復した国もある(英国や米国の一部など)。パンデミックの正味の影響はまだ調査中だが、おそらく以下のようなものだろう。 遅延 離婚を防ぐどころか、多くの離婚を生むことになる。また、新たなストレス(ロックダウンの葛藤)をもたらし、長期的には離婚を増加させる可能性もある。例えば、中国やヨーロッパ諸国からの逸話的証拠によれば、ロックダウンが解除された直後に離婚届が急増した。全体として、パンデミックは、外的な出来事が一時的に家族の力学を変化させるが、その後中核的な傾向が再開することを浮き彫りにした。
結論として 世界の離婚率は社会の変化を映す鏡である.急速な社会移行(経済発展、性別役割分担の変化、世俗化)の最中にある国では、既成の規範が崩れ、個人が自己実現を優先するため、離婚が増加することが多い。逆に、伝統的な構造を堅持する社会では、それが選択によるものであれ、強制によるものであれ、離婚はまれである。世界が発展し、文化的価値観が進化し続けるにつれて、ある程度までは離婚率が上昇する国が増えるだろう。実際、国連によれば、世界中で離婚/別居している成人の割合は増加しており、1970年代から2000年代にかけて倍増している。それでも、次のようなことも考えられる。 コンバージェンス極端に離婚率の高い国は(結婚が一般的でなくなるか、マッチングが良くなって関係が強化されるにつれて)安定するかもしれないし、極端に離婚率の低い国は、態度が自由化されるにつれて徐々に増加するかもしれない。
政策の観点からは、このデータは、夫婦関係の安定と個人の幸福のバランスをとる必要性を示唆している。離婚率の高い社会は、ひとり親家庭を支援し、離婚した子ども(経済的・精神的な影響を受けることが多い)のニーズに対応するという課題に直面している。一方、離婚率の低い社会は、社会的または法的な圧力によって結婚に閉じ込められた個人の権利と福祉を考慮しなければならない。最終的には、離婚率を恣意的に上下させることが目的ではなく、以下のことを確実にすることが目的である。 結婚は自由な選択によって結ばれ、結ばれない そして、家族構成に関係なく、家族や個人が必要な支援を受けられるようにする。ある文化圏では生涯結婚がほぼ普遍的である一方、ある文化圏では結婚がコインの裏表のようなものであるなど、離婚に関する世界的な図式は驚くほど多様である。
情報源 データは国連より作成 人口統計年鑑世界銀行およびOECDの家族データベース、各国の統計機関(EU諸国についてはEurostat、アメリカについてはU.S. CDC/NCHSなど)、および国を超えた離婚決定要因に関する学術研究。国別の婚姻率と離婚率に関する数値は、上記で引用したように、入手可能な最新の公式記録によるもので、Our World in Dataが過去の傾向を視覚化している。これらの情報源を総合することで、世界の離婚パターンを信頼できる最新の形で表現することができる。