导言和关键指标
在过去的几十年里,离婚在世界范围内变得越来越普遍,尽管不同国家和地区的离婚趋势大相径庭。从 20 世纪 70 年代到 2000 年代,全球的粗离婚率(每千人年离婚率)大约翻了一番。例如,在欧洲联盟,离婚率从大约 1964 年每千人 0.8 人 至 2023 年为千分之 2.0尽管同期结婚率下降了 50%。然而,离婚模式远非千篇一律--它们反映了每个国家的社会规范、法律框架和人口趋势。衡量离婚的两种主要方法是
- 粗离婚率: 特定年份中每千人的离婚数量。这表明人口中每年的离婚频率。
- 离婚与结婚比率(离婚百分比): 相对于结婚数量的离婚数量,通常用百分比表示(如每 100 次结婚中的离婚数量)。由此可以大致得出 终生风险 婚姻最终会以离婚告终。例如,50% 的比率表明约有一半的婚姻以离婚告终。
重要的是要结合实际情况来解释这些指标。未婚人口比例或年龄结构都会对粗离婚率产生影响。离婚率是对终生离婚风险的粗略估计;它假定当前的结婚和离婚模式保持不变,但实际上,实际的终生离婚率是通过对婚姻队列进行长期跟踪计算得出的。尽管如此,这些指标合在一起,还是可以提供离婚率的有用信息。
各国离婚统计数据(最新数据)
下表列出了有可靠数据的国家的离婚率,包括最近一年的数据、粗离婚率、粗结婚率以及以离婚告终的婚姻的估计百分比(离婚与结婚比率)。这提供了按国家分列的离婚率。
欧洲
欧洲是世界上离婚率最高的地区之一。许多欧洲国家和前苏联国家在 20 世纪末离婚率激增,目前有 40-90% 的婚姻以离婚告终。相比之下,最近才实现离婚合法化或正常化的一些欧洲国家的离婚率要低得多。
| 国家 | 数据年份 | 每千人离婚率 | 每千人婚姻数 | % 以离婚告终的婚姻 |
|---|---|---|---|---|
| 西班牙 | 2020 | 1.6 | 1.9 | 84.2% (世界最高) |
| 俄罗斯 | 2020 | 3.9 | 5.3 | 73.6% |
| 乌克兰 | 2020 | 2.9 | 4.1 | 70.9% |
| 法国 | 2016 | 1.9 | 3.7 | 51.3% |
| 葡萄牙 | 2023 | 2.0 | 2.8 | 47% |
| 瑞典 | 2018 | 2.5 | 5.0 | 50.0% |
| 意大利 | 2018 | 1.5 | 3.2 | 46.9% |
| 德国 | 2017 | 1.9 | 4.9 | 38.8% |
| 英国 (E&W) | 2015 | 1.8 | 4.4 | 40.9% |
| 波兰 | 2018 | 1.7 | 5.1 | 33.3% |
| 罗马尼亚 | 2018 | 1.6 | 7.4 | 21.6% |
| 爱尔兰 | 2017 | 0.7 | 4.6 | 15.2% |
| 马耳他 | 2018 | 0.7 | 5.8 | 12.1% |
欧洲: 西班牙脱颖而出,估计 90% 婚姻以离婚告终离婚率是世界上最高的国家之一。相比之下,最近才允许离婚的传统天主教国家(如 马耳他(2011 年), 爱尔兰(1996 年)) 的离婚率仍然很低(低于 0.8‰),只有约 12-15% 的婚姻以离婚告终。西欧主要国家的离婚率介于两者之间:如大约 50% 的婚姻 法国 以离婚告终, ~41% 在 英国和 ~39% 于 德国.北欧国家约有 45-50% 的婚姻以离婚告终(如瑞典 ~50%)。许多东欧国家和后苏联国家的离婚率都很高:例如 俄罗斯 (74%) 和 乌克兰 (71%)。这些国家在苏联时期和之后离婚率激增。同时,一些东欧国家的离婚率较低(罗马尼亚约为 22%,传统上是由于比较保守的规范)。总体而言,欧洲的粗离婚率大多介于大约 千分之一至千分之三但由于结婚率的不同,离婚与结婚的比例也大相径庭。欧洲离婚率长期上升的部分原因是法律变化--意大利(1970 年)、西班牙(1981 年)、爱尔兰(1996 年)和马耳他(2011 年)离婚合法化,导致这些国家的离婚率随着时间推移不断上升。
北美
北美洲的离婚率也相对较高,不过最近一些地区的离婚率呈下降趋势。
| 国家 | 数据年份 | 每千人离婚率 | 每千人结婚率 | % 以离婚告终的婚姻 |
|---|---|---|---|---|
| 美国 | 2020 | 2.3 | 5.1 | 45.1% |
| 加拿大 | 2008 | 2.1 | 4.4 | 47.7% |
| 古巴 | 2010 | 2.9 | 5.2 | 55.8% |
| 墨西哥 | 2020 | ~1.0 | ~5.5(估计值) | ~20% (估计值) |
| 智利 | 2009 | 0.7 | 3.3 | 21.2% |
| 危地马拉 | 2019 | (非常低) | (高) | ~5%(估计值) |
北美: "(《世界人权宣言》) 美国 长期以来,美国一直是主要国家中粗离婚率最高的国家之一(20 世纪 80 年代初达到峰值,接近 5.0)。2000 年,美国的离婚率为每千人 4.0 例,但此后已降至每千人 千分之 2.3 截至 2020 年。今天大约 42-45% 据估计,美国有一半的婚姻以离婚告终。邻国 加拿大 类似,大致 48% 的婚姻以离婚告终(截至 2008 年)。加勒比和中美洲地区 古巴 离婚率极高,约为 56% 的婚姻以离婚告终,这反映出当地历来容易离婚。相比之下 墨西哥粗离婚率(~1.0)相当低;由于家庭传统浓厚,估计只有 20-25% 的墨西哥婚姻以离婚告终(根据最新数据得出的近似值)。一些拉丁美洲国家的离婚率历来很低(在某些情况下是因为直到最近才禁止离婚或离婚并不常见)。例如 智利 拉丁美洲的离婚率在 2004 年才合法化,到 2009 年仍然很低(0.7‰,约为 21%)。总体而言,21 世纪拉丁美洲的离婚率一直在上升,但文化规范使离婚率保持在较低水平--中美洲许多国家(如危地马拉、洪都拉斯)报告的离婚率远低于千分之一,这意味着以合法离婚告终的婚姻不到 10%(尽管非正式分居可能更高)。
亚洲
亚洲展示了 最广泛 离婚率的差异反映了不同的文化和法律。一些东亚和欧亚国家的离婚率最高,而南亚的离婚率最低。
| 国家 | 数据年份 | 每千人离婚率 | 每千人结婚率 | % 以离婚告终的婚姻 |
|---|---|---|---|---|
| 中国 | 2018 | 3.2 | 7.2 | 44.4% |
| 韩国 | 2019 | 2.2 | 4.7 | 46.8% |
| 日本 | 2019 | 1.7 | 4.8 | 35.4% |
| 以色列 | 2009 | 1.8 | 6.5 | 27.7% |
| 沙特阿拉伯 | 2020 | 2.1 | 5.6 | 37.5% |
| 哈萨克斯坦 | 2021 | 2.5 | 7.3 | 34.3% |
| 土耳其 | 2018 | 1.7 | 6.8 | 25.0% |
| 越南 | 2015 | 0.4 | 5.7 | 7.0% |
| 印度 | ~2018 | 0.1 | ~10 | ~1%(最低) |
| 菲律宾 | 不适用 | 离婚非法 | - | 0%(法律禁令) |
亚洲: 几个 东亚 这些国家经历了快速的社会变革,现在离婚率很高。 韩国20 世纪 90 年代至 2000 年代,美国的离婚率急剧上升,到 2019 年,约有 1.5 亿人离婚。 47% 的婚姻以离婚告终。 中国2000 年代,美国的离婚率同样攀升至约 千分之 3.2 (事实上,截至 2019 年的 16 年里,中国的离婚数量每年都在增加(2021 年的新 "冷静 "法导致中国的离婚申请数量突然下降,但这是否会持续下去还是仅仅是推迟了离婚的时间还存在争议)。(2021 年新颁布的 "冷静期 "法律导致中国的离婚申请数量骤减,但这一现象是持久的还是只是推迟了离婚,还存在争议)。 日本 日本的离婚率在 2002 年左右达到顶峰,随后有所下降。 35% 的婚姻以离婚告终。在 东南亚在美国,离婚率往往处于中等或偏低的水平,部分原因是宗教和文化规范。例如 越南 仅报告 每 1 000 人中有 0.4 例离婚 和7% 的婚姻以离婚告终。 印度尼西亚 尽管穆斯林人口众多(伊斯兰教允许离婚,但实际上离婚并不频繁),但南亚的粗离婚率也很低(约为 1.2)。南亚是世界上离婚率最低的地区。 印度的 粗离婚率仅为 千分之 0.1和 仅在 1% 左右 的印度婚姻以合法离婚告终。这一极低的离婚率是由于印度社会对离婚的强烈鄙视、大家庭的压力以及法律障碍造成的。其他南亚和中东国家的离婚率也非常低(例如:印度、印度尼西亚、马来西亚、泰国、菲律宾、泰国、印尼)。 斯里兰卡 ~0.15 per 1,000,占婚姻的百分之几)。另一方面,中东部分地区有 更高 离婚率:例如 沙特阿拉伯 和 哈萨克斯坦 (穆斯林占多数的中亚国家)都看到 30-40% 的婚姻以离婚告终。在海湾国家,离婚相对普遍,例如 科威特 尽管女性面临更多的障碍,但法律对男性的宽松政策还是为她们提供了便利。值得注意的是 菲律宾 (和梵蒂冈)是唯一突出的国家 离婚完全是非法的结果基本上是 0% 的婚姻以离婚告终(有可能宣布婚姻无效,但很少见)。这种法律禁令使记录在案的离婚率保持为零,即使分居仍然会发生。
非洲
非洲可靠的离婚统计数据很少,但现有数据表明,除个别情况外,离婚率普遍较低。许多非洲人的婚姻是习俗婚姻或宗教婚姻,可能会在正式法律制度之外解除,因此官方的离婚率很低。
| 国家 | 数据年份 | 每千人离婚率 | 每千人结婚率 | % 以离婚告终的婚姻 |
|---|---|---|---|---|
| 南非 | 2009 | 0.6 | 3.5 | 17.1% |
| 埃及 | 2021 | 2.4 | (估计~9) | ~25%(估计值) |
| 毛里求斯 | 2010 | 1.4 | 8.2 | 17.1% |
| 尼日利亚 | ~2016 | (非常低) | (高) | (<5%) (估计) |
| 摩洛哥/阿尔及利亚 | ~2018 | ~1-1.5 | ~7-8 | ~15-20%(估计值) |
非洲: 在许多非洲国家 粗离婚率低于千分之一这表明正式离婚相对较少。例如 南非 - 其中一个记录较好的案例--只有 每 1 000 人中有 0.6 例离婚 2009 年,约有 17% 有几个因素导致离婚率较低。导致记录在案的离婚率较低有几个因素:非洲部分地区的社会/宗教强烈反对离婚;非正式分居或一夫多妻制婚姻普遍存在,可能不会以法院判决告终;以及在办理离婚时存在实际困难(尤其是对妇女而言)。在北非和中东,伊斯兰法对婚姻有影响,法律允许离婚,但往往附带条件。 埃及例如,随着人们观念的慢慢转变,近年来离婚人数不断上升(2021 年为千分之 2.4),是非洲离婚率较高的国家之一,但妇女往往必须放弃经济权利才能提出离婚。其他非洲国家如 毛里求斯 (17%) 和 摩洛哥 (15-20%)的离婚与结婚比率适中。一般来说,非洲社会重视婚姻的稳定性,许多离婚是在没有官方统计的情况下发生的(例如通过社区长老)。值得注意的是,在撒哈拉以南非洲的部分地区、 工会的不稳定性可能很高 (由于社会经济压力或丧偶等因素),但这些情况并不总是作为 "离婚 "记录在数据中。在有数据的情况下,这些数据往往显示出一种模式:城市和受过教育的人口的离婚率高于农村人口,这反映出夫妻在分居方面有更大的自主权。
大洋洲
大洋洲的离婚模式与西方国家相似。
| 国家 | 数据年份 | 每千人离婚率 | 每千人结婚率 | % 以离婚告终的婚姻 |
|---|---|---|---|---|
| 澳大利亚 | 2020 | 1.9(估计值) | 4.6(估计值) | ~41% |
| 新西兰 | 2020 | 1.5(估计值) | 3.6(估计值) | ~42% |
| 斐济 / 太平洋岛屿 | ~2018 | (低) | (不等) | (10-20%) (估计) |
大洋洲 澳大利亚 和 新西兰 离婚率与欧洲和北美相当。大约 40-45% 在澳大利亚和新西兰,预计有一半的婚姻会以离婚告终。例如,在新西兰,2022 年的粗离婚率为 1.6‰,而该年每 1000 对已婚夫妇中约有 7.6 对离婚--这意味着类似的离婚风险约为 40%。这两个国家的离婚率在 20 世纪末都有所上升,但近年来随着结婚率的下降,离婚率趋于稳定或略有下降。相比之下,许多较小的太平洋岛国(斐济、萨摩亚等)的家庭结构更为保守,数据有限,但传闻证据表明离婚率相对较低(通常低于千分之一)。
表注 数据反映最近一年的情况(括号内)。"% 婚姻以离婚告终 "的计算方法为当年离婚数÷婚姻数×100(对终生离婚风险的高水平估计)。实际的终生离婚概率可能略有不同,尤其是在经历快速变化的国家。不过,这个百分比是一个有用的比较指标。我们引用了包括《联合国人口统计年鉴》和国家统计机构在内的权威资料来源提供的这些数字。一般来说 全球离婚率从低于 0.5‰(少数离婚率较低的社会)到离婚率最高的国家的约 3-4‰ 不等而以离婚告终的婚姻比例则从 5% 以下到 90% 以上不等,这一惊人的范围反映了法律和文化上的极端情况。
全球最高和最低离婚率
在全球范围内 离婚率最高 (根据联合国的最新数据,年离婚率最高的国家包括:苏联解体后的国家、欧洲部分地区以及其他一些地区。根据联合国的最新数据,年离婚率最高的国家包括
- 北马其顿 每千人离婚 9.6 例 (2023年)--最近的一次飙升使这个巴尔干小国位居榜首(2023年的离婚率异常之高可能是由于大流行后处理的离婚案件积压或其他异常情况)。
- 马尔代夫: 千分之五点五 (马尔代夫(2020 年)--历史上,马尔代夫的离婚率极高(2002 年达到峰值,每千人中有 10.97 人离婚,创下吉尼斯世界纪录),这归因于多重婚姻的文化规范。即使在最近几年,马尔代夫每千人的离婚率也在 5 次以上,居世界首位。
- 白俄罗斯、格鲁吉亚、摩尔多瓦: 围绕 千分之 3.7-3.8 (2021-2022).几个前苏联加盟共和国位居榜首,反映了后苏联时代社会对离婚的接受程度高和经济压力大。例如,白俄罗斯的离婚率为千分之 3.7,摩尔多瓦为千分之 3.7。
- 拉脱维亚、立陶宛: ~千分之 2.5-2.9 (2022).波罗的海国家的离婚率一直居高不下,拉脱维亚目前的离婚率为 2.8,居欧盟之首。
- 美国: ~千分之 2.3 (2020 年)--虽然美国曾经位居前列,但其比例已经下降,与东欧相比,现在处于中等水平。
在 "终生 "离婚风险(以离婚告终的婚姻比例)而离婚率最高的国家包括离婚率最高的国家包括
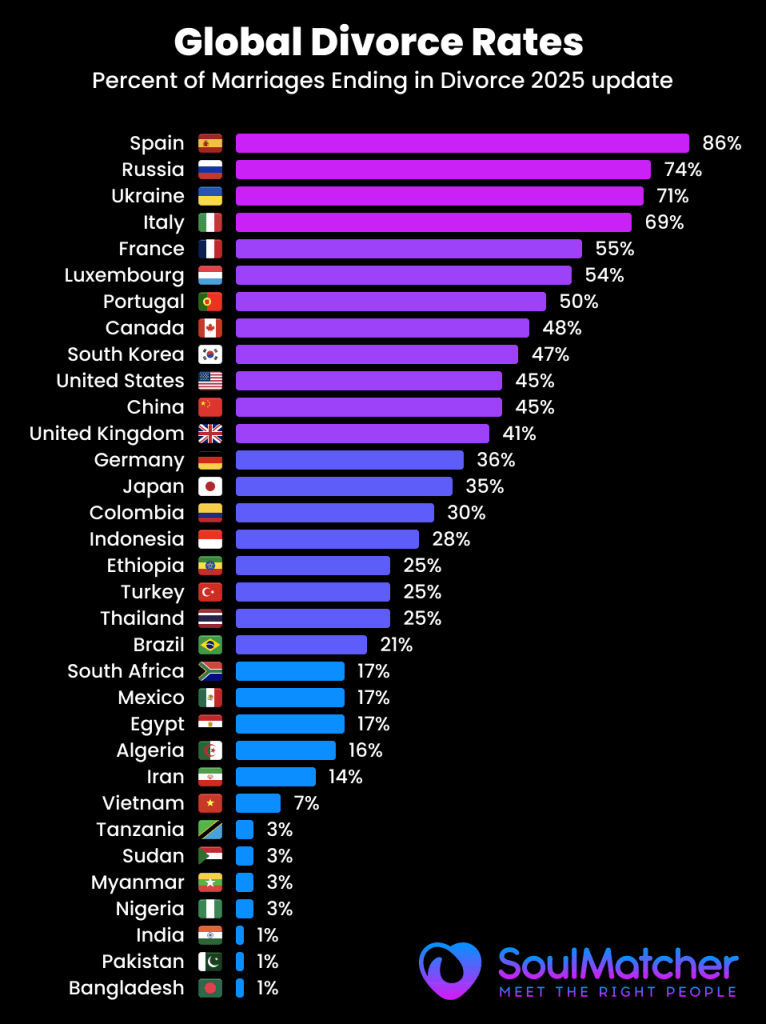
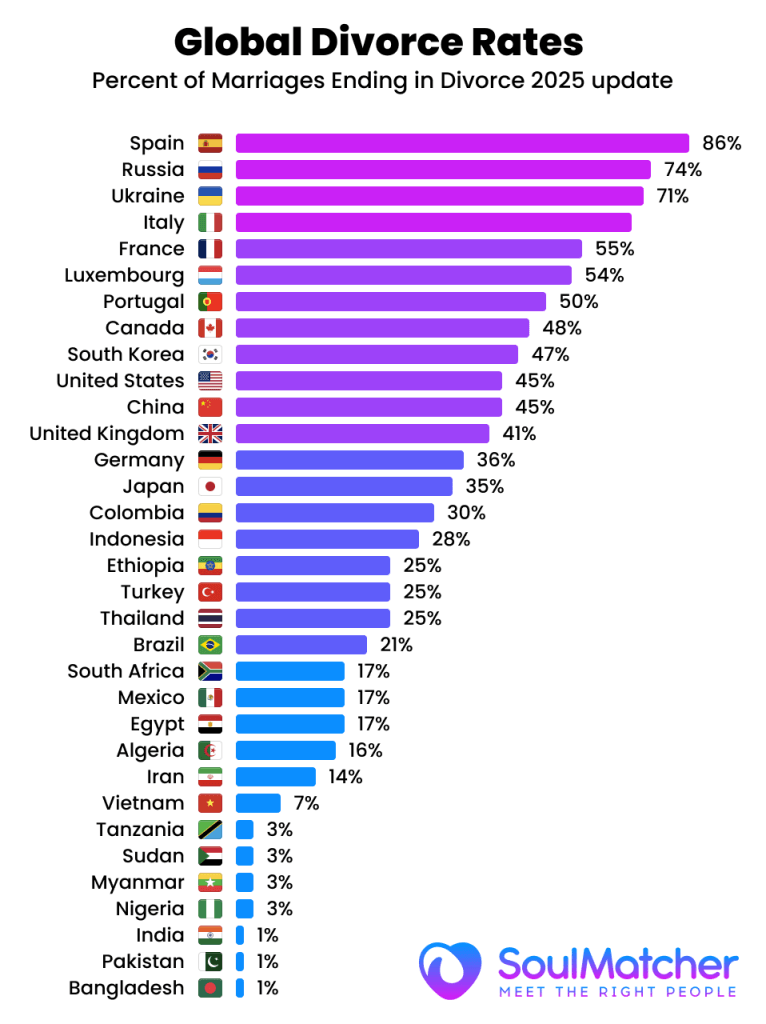
- 西班牙: ~85% 的婚姻以离婚告终。1981 年离婚合法化后,西班牙的离婚率急剧上升,由于新婚夫妇相对较少,最近的数据显示离婚率极高。
- 俄罗斯: 73-74%; 乌克兰: ~71%; 白俄罗斯: ~60-65% (估计值)。这些斯拉夫国家的婚姻更替率很高--结婚人数很多,但离婚人数相对更多。
- 古巴: ~56%; 法国: ~51%; 瑞典: 50%.许多西方国家的离婚率都在 50% 左右,这意味着大约一半的婚姻最终会解体(人们常说的 "一半的婚姻以离婚告终 "在美国、法国、英国等国大致如此)。
相比之下 离婚率最低 在对离婚存在法律或文化障碍的社会中,存在着许多离婚障碍。这些障碍包括
- 印度: 只有大约 1% 的婚姻以离婚告终。印度的粗离婚率(约 0.1)是有记录以来最低的。强烈的耻辱感和忍受婚姻的期望导致离婚率极低。
- 不丹、斯里兰卡、越南: 只有 5-7% 的婚姻以离婚告终。这些亚洲国家的离婚率远低于 0.5‰。例如,斯里兰卡的离婚率为 0.15,而且离婚往往需要漫长的法律程序。
- 哥伦比亚和许多非洲国家: 经常 10-20% 离婚的可能性。许多受天主教或社区影响较大的非洲和拉丁美洲国家(如危地马拉、刚果、尼日利亚)报告的离婚率非常低。
- 菲律宾和梵蒂冈城: 0% (没有合法离婚)。在菲律宾,只有通过婚姻无效或死亡才能结束婚姻。因此,菲律宾的官方离婚率实际上为零,在全球离婚率排名中也经常垫底。
图:离婚率世界地图(按国家分列的 "离婚几率")。暖色(红色)表示离婚率或离婚可能性较高,冷色(绿色)表示离婚率较低。灰色表示数据不足。该地图显示,离婚在前苏联、欧洲部分地区和北美最为常见,而在南亚、非洲部分地区和一些东南亚国家则最少见。
正如地图和数据所示、 不同地区的离婚率差异巨大.一般来说,发达地区和社会规范较为自由的地区(欧洲、北美、大洋洲)离婚率较高,而社会规范较为传统或限制性较强的发展中地区(南亚、中东、非洲)离婚率较低。不过,也有明显的例外--例如,较富裕的东亚国家(日本、韩国)离婚率适中,而一些较贫穷的国家(如前苏联地区)由于独特的历史因素,离婚率较高。文化态度、宗教和法律结构在很大程度上影响着这些结果,下文将对此进行讨论。
主要国家的历史离婚趋势
许多国家的离婚率出现了 倒U字形 在过去的 50 多年里,这一变化的轨迹是:在 1970--1990 年代急剧上升,然后在 2000 年代趋于平稳或下降。高峰出现的时间和高度因国家而异,反映了不同的社会变化。下图 1 展示了各大洲部分国家的离婚率趋势,凸显了这些不同的模式。
图 1:1960-2020 年部分国家的离婚率趋势(每年每千人离婚率)。许多西方国家(如 美国, 英国, 挪威) 的离婚率从 20 世纪 60 年代开始攀升,在 20 世纪 70 年代至 80 年代左右达到峰值,随后有所下降。一些东亚和东欧国家 (韩国, 爱沙尼亚, 波兰随着离婚被越来越多的人所接受,离婚率后来(大约在本世纪初)达到顶峰。其他如 土耳其 显示出从低基数到 2010 年代的稳步上升。(数据来源:经合组织/联合国,通过 "我们的数据世界")。
在 美国随着无过错离婚法的实施和性别角色的变化,美国的粗离婚率从 1960 年的约 2.2%上升到 1981 年的 5.3%.创历史新高。此后,离婚率稳步下降,到 2021 年降至 2.5,为 50 年来最低。离婚率下降的部分原因是年轻一代结婚更晚、更有选择性,从而使婚姻更加稳定。美国初婚者的离婚风险有所下降(目前估计总体离婚风险约为 40-45%)。同样、 加拿大 和 澳大利亚 这些国家的离婚率在 20 世纪 80 年代达到顶峰,随后有所下降。例如,澳大利亚的离婚率在 1975 年开始无过错离婚后急剧上升,随后趋于稳定;澳大利亚以离婚收场的婚姻比例实际上已经下降了 下来 从 20 世纪 80 年代的约 50% 到现在的 ~41%。
在 西欧然而,大多数国家的离婚率在 1970 年至 1990 年间急剧上升。离婚率 英国 20 世纪 90 年代中期,离婚率达到顶峰,每千人约有 3 例离婚(20 世纪 90 年代的改革放宽了离婚率),此后下降到每千人约有 1.8 例离婚。 斯堪的纳维亚 这些国家是最早上升的国家之一(例如,瑞典在 20 世纪 80 年代达到千分之 2.5,目前仍保持在千分之 2.0-2.5 左右)。 南欧 在离婚合法化之前,意大利、西班牙、葡萄牙等国的离婚率非常低(西班牙 1981 年,葡萄牙 1975 年,意大利 1970 年)。合法化之后,这些国家的离婚率急剧上升:特别是在 2005 年的一项法律放宽了离婚程序后,西班牙的离婚率急剧上升,导致了目前的高离婚率。葡萄牙的离婚率在 20 世纪 90--2000 年代也迅速攀升。有趣的是,一些西方国家最近出现了 衰退 离婚率:例如 德国、荷兰、法国 自 2000 年代初以来,这些国家的粗离婚率都略有下降。这通常归因于当初结婚的人越来越少(因此能够离婚的人也越来越少),也可能是因为同居的人越来越多,结婚年龄越来越高(这降低了离婚的风险)。美国 欧盟整体 其离婚率在 2006 年左右达到顶峰,为 2.1,然后小幅下降,到 2019 年降至 1.8-2.0。
在 东欧和前苏联在 20 世纪 90 年代的过渡时期,离婚率非常高。 俄罗斯 和 乌克兰 在 20 世纪 90 年代至 2000 年代,俄罗斯的结婚率达到顶峰,粗略统计约为千分之四至五,反映了后苏联时代的社会动荡和新自由。此后,俄罗斯的人口出生率有所放缓,约为 3.9(截至 2020 年),但相对于结婚率而言仍然很高。波罗的海国家(爱沙尼亚、拉脱维亚、立陶宛)在 20 世纪 90 年代末都出现了离婚高峰,并一直居高不下(拉脱维亚 2023 年的离婚率为 2.8,是欧洲离婚率最高的国家之一)。最近,一些东欧国家的离婚率呈下降趋势(如:爱沙尼亚、拉脱维亚和立陶宛)。 波兰 2006年左右达到顶峰,随后略有下降),这可能是由于文化上对家庭的重视以及年轻人结婚的减少(波兰仍然是欧洲结婚率最高的国家之一)。
亚洲的 趋势多种多样。 日本的 离婚率在二战后逐渐上升,2002 年达到约 2.1,然后随着人口老龄化和结婚的年轻人减少,到 2019 年下降到约 1.6-1.7。 韩国 韩国和日本的离婚率上升较晚,但上升幅度更大:从 1990 年的 1.1 到 2003 年的约 3.5,增加了两倍,然后到 2010 年下降到约 2.2,并趋于平稳。韩国和日本的这种先高后低的模式,部分原因是世代交替(20 世纪 80-90 年代结婚的人群离婚率较高,但年轻的人群结婚率较低,且婚姻更稳定)。 中国 值得注意的是,在整个 2000 年代,离婚率持续上升:中国的粗离婚率从 20 世纪 80 年代的极低基数上升到 2018 年的 3.2。中国政府最近于 2021 年引入了 30 天的等待期,据报道登记离婚率随即下降了 70%,但这可能表明了延迟或未登记的分居,而非真正的行为转变(一些中国夫妇急于离婚)。 之前 从长期来看,中国的离婚趋势反映了个人主义的增强和城市地区离婚耻辱感的减少。)从长远来看,中国的这一趋势反映了城市地区个人主义的增强和离婚耻辱感的减少。在 印度相比之下,印度的离婚率长期以来一直微不足道--没有类似的 "离婚热潮",历史耻辱感使离婚率接近于零(尽管近年来印度城市的离婚率正在缓慢上升)。
许多 中东 和 北非 有些国家缺乏长期数据,但有些国家(如 埃及 和 约旦)显示,2010 年代离婚人数不断上升,这可能是由于社会的逐步变化和法律改革。例如,埃及的离婚率在整个 2010 年代都在上升,到 2021 年达到最高点(2.4‰)。 海湾国家 据报道,阿联酋、卡塔尔和科威特等国在 20 世纪 90 年代至 2000 年代的离婚率较高(卡塔尔在 2005 年左右达到峰值,约为千分之 2.2,科威特更高),随后趋于稳定。这些趋势往往与现代化和妇女教育水平的提高相吻合,从而使人们更愿意结束不幸的婚姻。
在 非洲然而,历史数据有限。然而,轶事证据表明,在一些南部非洲国家,离婚在 2000 年后变得更加普遍(例如,在南非,离婚率为 0.5%,在非洲,离婚率为 0.5%,在非洲,离婚率为 0.5%)。 博茨瓦纳 和 南非 20 世纪 90 年代离婚率有所上升,随后略有下降)。自 2004 年以来,南非记录在案的离婚数量缓慢下降,这可能是由于正式婚姻减少、同居增多所致。相比之下,以下国家 埃塞俄比亚 或 尼日利亚 尽管分居率可能较高,但历史上正式离婚率仍然很低。
总之,主要发达国家大多已度过了 "离婚革命 "的高峰期--20 世纪末攀升的离婚率在 21 世纪已趋于平稳或开始下降。发展中国家则处于不同的阶段:一些国家(特别是东亚、拉丁美洲部分地区)在 2000 年代离婚率激增,目前已趋于平稳,而另一些国家(南亚、非洲部分地区)则由于持久的文化限制,离婚率尚未显著上升。
地区和经济模式
在比较不同 大洲和经济集团在离婚率方面,出现了明显的模式:
- 欧洲和北美: 这些高收入地区有 中高离婚率.经合组织高收入国家的平均粗离婚率约为 千分之 1.8 在欧洲,欧盟的平均值约为 2.0。在欧洲,欧盟的平均离婚率约为 2.0。几乎所有西方国家都允许无过错离婚,而且法律障碍极少,因此离婚率很高。然而,在这一群体中也存在差异:北欧和西欧(以及北美/大洋洲)的离婚率往往在 40-50% 左右,而传统的天主教或东正教国家(爱尔兰、波兰、意大利)的离婚率较低,但也在上升。 经济发展和城市化 由于妇女的经济独立和社会安全网使其更有可能离开婚姻,因此,女性受教育程度越高,离婚率越高。事实上,研究发现,女性受教育程度和劳动力参与程度较高的国家通常离婚率较高。这一点在斯堪的纳维亚(性别平等程度高,离婚率相对较高)与欠发达地区的对比中很明显。同时,极高的离婚率也可以反映出 社会混乱 - 例如,俄罗斯及其邻国(中上收入国家)的离婚率超过了许多富裕国家,原因是社会经济紧张,宗教对政策的影响较弱。
- 亚洲: 亚洲不能一概而论,因为它既包括一些国家,也包括一些地区。 最低 和 最高 离婚社会。一般来说 东亚和中亚 现在,许多国家(如韩国、中国、哈萨克斯坦)的离婚率与西方国家不相上下。相比之下 南亚(印度、孟加拉国、巴基斯坦) 由于文化规范(重男轻女的家庭制度、耻辱感、包办婚姻传统),离婚率仍然极低。 东南亚 在这两者之间:印度尼西亚和马来西亚等穆斯林占主导地位的国家,尽管伊斯兰法允许男子相对容易地离婚(这可能会增加非正式离婚),但其离婚率却很低。在这些地区,家庭凝聚力和社会对离婚的羞耻感降低了离婚率。例如 越南 和 泰国 部分原因是大家庭经常调解婚姻问题。 经济因素 亚洲较贫穷的农业社会离婚率较低,因为家庭是一个经济单位,妇女可能缺乏婚外支持。然而,随着经济的发展和妇女机会的增多,离婚率往往会上升(例如,中国城市离婚率的迅速上升与经济自由化相吻合)。值得注意的是,离婚法限制性强的国家(如迄今为止的菲律宾)或要求长期分居的国家,离婚率自然较低。
- 中东和北非: 该地区的离婚率不高,但变化很大。一般来说,海湾阿拉伯国家(如科威特、卡塔尔、阿联酋)和北非国家报告的粗离婚率约为千分之一到二,没有欧洲那么高,但高于南亚。文化规范极不鼓励妇女提出离婚,但男子休妻的能力(在伊斯兰法中)可能导致男子提出离婚的比率较高。 性别不平等 性别不平等现象的影响:具有讽刺意味的是,一些性别不平等现象严重的中东国家 还 离婚率相对较高(因为男性可以自由离婚,而女性则要承担离婚的后果)。相反,也门或叙利亚等地的离婚率很低,这可能既反映了社会压力,也反映了妇女在离婚时面临的困难。近年来,随着法律改革使离婚变得更加容易,以及妇女受教育程度的提高,该地区较自由的地区(如突尼斯、伊朗、土耳其)的现代化进程略微提高了离婚率。例如,土耳其的离婚率虽然只有 1.7‰,但随着传统家庭结构的演变,离婚率一直在上升。
- 拉丁美洲: 由于天主教的影响(许多国家直到 20 世纪末才禁止离婚),拉丁美洲国家的离婚率历来较低。在过去几十年中 在整个拉丁美洲,离婚已成为合法且更为普遍的现象大多数拉丁国家的粗离婚率约为千分之一到二 (如巴西约为 1.4;哥伦比亚约为 0.7;哥斯达黎加为 2.6)。 古巴 古巴是一个明显的例外,是世界上离婚率最高的国家之一(超过千分之 2.5,>50% 的婚姻离婚),这通常归因于古巴革命以来的世俗和社会自由政策。多米尼加共和国和波多黎各的离婚率也相对较高,约为千分之 2.4-2.6。另一方面,文化保守的国家如 智利 和 秘鲁 离婚率仍然很低(智利的离婚率在 2010 年代离婚合法化后才超过 1.0‰)。总体而言,随着拉丁美洲的城市化和妇女权利的改善,离婚率逐渐上升,但以家庭为中心的文化使离婚率低于西方水平。重要的是 非正式离职 在拉美地区,合法婚姻和自愿结合很常见,这可能不会反映在离婚统计数字中--许多夫妇只是简单地分居而没有合法离婚,或者从一开始就没有正式结婚,从而影响了官方数字。
- 非洲: 非洲是数据最少的地区,但传统规范有利于婚姻稳定。许多非洲国家实行双重婚姻制度(民法和习惯法);习惯法下的离婚可能不会被正式计算在内。在有数据的国家(南非、埃及、毛里求斯、肯尼亚),粗略统计的离婚率大致如下 0.5 至 2.0.一般来说 撒哈拉以南非洲 离婚率很低。例如,尼日利亚和埃塞俄比亚报告的离婚率极低。一个例外是 博茨瓦纳在 20 世纪 90 年代,非洲的离婚率异常之高(超过 10% 的婚姻以离婚告终,这可能是由于母系社会结构造成的),但数据有限。在非洲社会中,彩礼(嫁妆)和社区调解等因素阻碍了离婚。然而,一夫多妻制和非婚同居可能会导致关系解体,而这并不被视为 "离婚"。值得注意的是,非洲女性识字率和就业率较高的国家(如南非、毛里求斯)的离婚率往往略高于女性自主权较低的国家。不过,与西方国家相比,即使在南非,离婚率也不高。 经济压力 它有时会使家庭破裂,但也会使婚姻成为一种必要的经济伙伴关系,让人们不愿离开。
从一个 经济分类 透视、 高收入经济体 平均离婚率高于 低收入经济体.发达国家不仅有较高的官方离婚率,而且有更宽松的法律和社会安全网来支持离婚者。相反,在低收入国家,婚姻往往与家庭荣誉、妇女的经济保障和社会地位交织在一起,从而抑制了离婚。例如,离婚率最低的前 10 个国家在联合国性别不平等指数上的得分都很低(表明妇女的角色更传统、更受限制)。这表明 极低的离婚率可能是女性权力有限或法律障碍的表现,而不是婚姻幸福的表现事实上,比较表明,许多离婚率最低的国家(如乌兹别克斯坦、蒙古、巴基斯坦)在性别平等方面排名靠后,而在离婚率最高的国家中,一些国家的性别平等程度相对较高(如瑞典、比利时),但也有一些国家的性别平等程度不高(俄罗斯、白俄罗斯)。总之,在离婚率最高的国家中,一些国家的性别平等程度较高(如瑞典、比利时),但也有一些国家的性别平等程度较低(俄罗斯、白俄罗斯)、 更多的个人自由和性别平等往往会提高离婚率,直至达到一定程度但是,极高的离婚率也可能源于中等收入国家的社会不稳定或规范的演变。高离婚率社会的经济水平参差不齐,但他们的共同点是在文化上接受结束婚姻。相反,离婚率最低的社会往往对离婚实施严格的法律/宗教限制或社会惩罚。
社会、法律和文化背景
离婚并非发生在真空中--它深受社会规范、法律和对婚姻的态度的影响。在此,我们将探讨社会、法律和文化因素如何导致离婚率的差异:
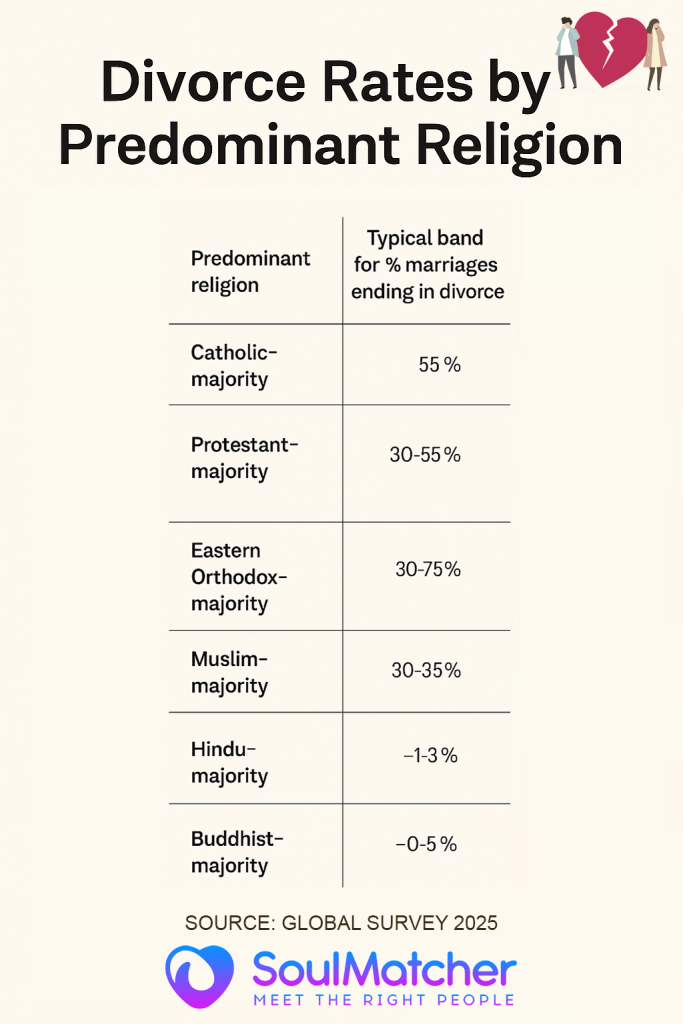
- 文化/宗教规范: 离婚率的最大决定因素或许是对婚姻持久性的文化态度。在一些社会中,婚姻被视为神圣的、不可分割的结合(通常以宗教为基础),因此很少离婚。例如,在 印度 在美国和许多穆斯林占多数的国家,离婚是相当耻辱的事情。家庭可能会给夫妻施加压力,要求他们在一起,即使是在不幸福或受虐待的情况下,以避免耻辱。在印度,婚姻的概念通常是 "终生",离婚会带来严重的社会耻辱,以至于只有约 1% 的婚姻破裂。同样,在历史上以天主教为主的国家(例如 菲律宾、爱尔兰、波兰),反对离婚的宗教教义使离婚率极低,直到法律发生变化。相比之下,强调个人幸福和个人成就感的文化往往离婚率较高。如今,在欧洲和北美的大部分地区,离婚虽然令人遗憾,但却为社会所接受,而且相当普遍。自 20 世纪 60 年代以来,由于世俗化的影响,这种接受度明显提高。例如 西欧 与之相对应的是更多的离婚(例如 西班牙的 20 世纪末,从天主教独裁政权向世俗民主政体的转变使得离婚率飙升至 85%)。 受儒家思想影响的东亚国家 (中国、韩国、日本)传统上重视家庭凝聚力,离婚率较低,但随着这些社会的现代化和更加个人主义,离婚失去了一些禁忌--韩国在 2000 年代初的离婚率飙升和中国的稳步攀升就是证明。值得注意的是,即使在同一国家,城市世俗人口的离婚率也高于宗教或农村社区。例如,在 美国由于宗教不鼓励离婚,福音派基督教社区的离婚率往往略低于全国平均水平,而自由派社区的离婚率则较高。
- 法律途径与改革: 离婚的难易程度是一个关键因素。离婚 非法或受到严格限制因此,利率自然极低。我们在 菲律宾和梵蒂冈城在不允许离婚的国家,正式离婚率为零。在需要较长分居期、特定理由(过错离婚)或双方同意的国家,离婚率通常低于快速无过错离婚的国家。例如 马耳他 美国在 2011 年实现离婚合法化时,最初要求分居四年,从而使离婚率在初期保持在较低水平。 爱尔兰 但这些国家仍有规定的离职期(最近从 4 年减至 2 年),这也是其离职率低(~15%)的部分原因。相比之下,拥有 无过错快速离婚程序 离婚率往往较高。美国(20 世纪 70 年代)和澳大利亚(1975 年)等地引入无过错离婚法后,由于夫妻双方不再需要证明自己有过错,离婚申请立即激增。如今,大多数西方国家允许无理由协议离婚,这使得离婚率的上升变得正常。一些国家甚至简化了离婚程序(例如,美国和加拿大)。 挪威 和 瑞典 在短暂的等待期后允许在线申请)。根据一项比较分析,离婚程序最简单、最省事的国家包括 挪威、瑞典、西班牙、墨西哥、斯洛文尼亚、阿根廷正如人们所预料的那样,所有这些国家的离婚率都处于中等偏上水平。相反,离婚法非常复杂的国家,例如 巴基斯坦 (妇女必须诉诸法院并证明理由充分,而男子可以单方面否认)或 埃及 (妇女必须放弃经济权利才能获得无过错 "库拉 "离婚)--离婚数量减少或男性主导的离婚申请增多。法律改革可以立即影响统计数据: 智利 在 2004 年之前,合法离婚率几乎为零;合法化之后,被压抑的需求导致数千人登记离婚,从而提高了离婚率。 巴西 在 2010 年取消规定的离职期后,离职率有所上升。在 中国此外,最近的冷静期法律似乎增加了离婚过程中的摩擦,从而暂时抑制了离婚人数。因此,法律制度对离婚友好还是厌恶,起着巨大的作用。
- 妇女权利与经济独立: 一个一致的结论是 离婚率随着女性社会经济地位的提高而上升.当妇女拥有教育、职业和合法权利时,她们就不太可能容忍不幸福或压迫性的婚姻。历史上,在妇女不能拥有财产或自食其力的社会中,离婚是罕见的,因为离婚往往会使妇女陷入贫困或社会流放。随着这些障碍的消除,离婚也随之增加。例如,20 世纪 70 年代西方国家的离婚率激增与妇女解放运动和更多妇女参加工作有关。 美国 在东亚,1990-2000 年代离婚率上升的同时,女性受教育程度和就业率也有所提高。)在东亚,20 世纪 90 年代至 2000 年代离婚率上升的同时,女性受教育程度和劳动力参与率也有所提高。 韩国、中国、台湾等。在中东,数据显示女性识字率较高的国家(如 伊朗、土耳其例如,在也门,离婚率非常低。在许多地方,都存在明显的性别因素、 女性比男性更常主动提出离婚 例如,在美国,大约 70% 的离婚是由女性提出的,这种模式在其他发达国家也可以看到,这表明随着女性变得更加独立,她们更愿意结束不令人满意的婚姻。同时,在离婚主要由男性提出的地方(由于法律或规范),如阿拉伯世界的部分地区,离婚可能具有不同的社会意义(有时高离婚率可能表明男性经常离婚和再婚)。总体而言,法律权利(如婚姻财产法、子女抚养费的执行)和社会支持(如减少离婚妇女的耻辱感)的改善消除了实际障碍,有助于提高离婚率。
- 经济压力与城市化: 与直觉相反,富裕和贫穷会以不同的方式影响离婚。经济稳定会促进离婚,因为伴侣不会为了生存而被迫在一起。与此同时 经济压力 (失业、通货膨胀)会使婚姻关系紧张并导致破裂。例如,苏联解体后,经济动荡很可能导致婚姻不稳定--俄罗斯的离婚率在 20 世纪 90 年代的经济危机期间急剧上升。据报道,在希腊,离婚率在最近的金融危机期间也有所上升。另一方面,经济衰退也会暂时 降低 如果夫妇拖延昂贵的法律诉讼或无力分居,离婚率就会下降。在 2008 年全球经济衰退时,一些国家的离婚率略有下降。 城市化 往往会增加离婚:在城市里,传统的家庭监督比较薄弱,人们会接触到更多不同的生活方式(和诱惑)。城市也为离婚者提供了更多的匿名性和支持网络。例如,中国离婚率最高的地区是上海和北京这样的大城市,而农村的离婚率要低得多。
- 不断变化的社会期望: 与传统的功利性婚姻相比,现代婚姻往往有着不同的期望(情感满足、角色分担)。一些学者认为,随着期望值的提高,对不满意婚姻的容忍度也会下降,从而导致更多的离婚。美国的情况就是如此:如果爱情和自我实现的需求得不到满足,婚姻向爱情和自我实现的方向转变就会导致离婚率上升。与他们的父辈相比,世界上年轻一代对离婚的态度普遍更加开放,这使得离婚逐渐正常化。A 联合国全球概览 指出,与 20 世纪 70 年代相比,到 2000 年代,30 岁左右离婚/分居的人数增加了一倍--这不仅反映了法律上的变化,也反映了社会接受了一个人不一定要留在不幸福的婚姻中的观点。此外,在亚洲等地区,包办婚姻的减少和恋爱婚姻的增加可能会增加离婚率:当个人基于爱情选择伴侣时,如果爱情消逝,他们也可能会选择离开,而包办婚姻则会带来更大的家庭压力,迫使他们坚持下去。
- 同居的影响 在许多西方国家,越来越多的 同居(未婚同居) 影响了离婚统计数据。同居可以作为 "试婚 "或婚姻的替代方式。在一些国家(如 瑞典、法国),许多夫妇没有结婚就同居甚至生子。其中有些婚姻破裂后并没有进入离婚统计。同居导致了结婚率的下降,而结婚率的下降反过来又会降低粗离婚率(因为一开始就结婚的人越来越少)。不过,同居也有可能是双向的:它可能会在婚前剔除较弱的关系(导致更稳定的婚姻),也可能反映了一种转变,即那些本来会结婚又离婚的人,只是同居后又分居了。总的来说,同居现象在欧洲和美洲的兴起是近来离婚率趋于平稳或下降的原因之一--有些分手不算 "离婚"。
- 政策和支持系统: 有些政府积极执行影响离婚的政策。例如 强制咨询或调解 (瑞典和美国一些州的做法)可能会减少冲动离婚。相反,支持单亲家庭的福利政策会使离婚更加可行。 儿童监护和抚养法 如果法律能确保子女和收入较低的配偶得到供养,配偶双方就会更自由地离婚。在缺乏这种支持的国家,父母(尤其是母亲)可能会为了孩子而维持婚姻。数据显示,在国家提供安全网的地方,离婚率较高(例如,北欧的慷慨福利与高离婚率相吻合,因为个人不会冒着穷困潦倒的风险离开婚姻)。一些国家(特别是 马来西亚、印度尼西亚)试图通过更严格的离婚程序或社区和解计划来巩固家庭,但结果喜忧参半。COVID-19 大流行病是政策与环境相互作用的一个最新实例:封锁最初导致了一个家庭的破裂。 滴剂 2020 年全球离婚率下降(法院关闭,夫妻推迟分手)。但在一些地区,由于被压抑的需求得到释放,离婚率随后出现反弹(例如 拉脱维亚 离婚率在 2020 年下降后,于 2021-22 年跃升)。
总而言之 社会环境至关重要 这对了解离婚率很有帮助。高离婚率社会通常具有世俗态度、便捷的法律程序、更大的性别平等以及强调个人选择。低离婚率社会通常具有强烈的宗教或宗族控制、法律障碍以及对离婚(尤其是对妇女)的重大社会或经济惩罚。这并不是说低离婚率国家的人们从未经历过婚姻破裂或冲突,而是说维持婚姻的压力(或离婚机制的缺乏)使婚姻保持在纸面上。与此同时,离婚率高的国家往往拥有支持系统和社会认可度,如果婚姻关系不尽如人意,结束婚姻也是一条可行的途径。正如一份研究摘要所说 "一般来说,一个国家的妇女受教育程度越高,该国的离婚率就越高"。 社会科学家还指出,人们对离婚的态度既影响离婚率,也受离婚率的影响:随着离婚在社会中变得越来越普遍,离婚就会进一步失去耻辱感,从而形成一个正常化的反馈循环。
结论和重要启示
世界各地的离婚率反映了文化价值观、法律框架、经济条件和社会变革之间复杂的相互作用。几个 主要结论 本全面概述中的内容包括
- 全球趋势: 20 世纪后半叶,全球离婚率上升,尤其是在西方国家,但在 21 世纪,这一趋势出现了分叉。自 2000 年以来,许多高收入国家的离婚率趋于稳定或有所下降,而一些中等收入国家的离婚率仍在上升。到 2020 年代,世界平均粗离婚率大约为 千分之一至二但这一平均数掩盖了巨大的差异。
- 最高比率: 离婚率最高的国家往往位于 东欧(前苏联)部分 西欧和一些 新世界 国家。按以离婚告终的婚姻比例衡量、 西班牙(~85%) 领先,其次是 俄罗斯(~74%)、**比利时(~70%)*和 古巴(~56%).这些地方要么结婚率很低,要么离婚率很高(或两者兼而有之)。按年粗离婚率计算,排名靠前的地方包括 马尔代夫, 哈萨克斯坦/白俄罗斯/格鲁吉亚 (~3.5-3.8),以及最近的一个离群值 北马其顿.一般来说,离婚率超过千分之三在当今的背景下被视为高离婚率。离婚率高的国家往往经历了快速的社会自由化或经济动荡,从而放松了传统的家庭纽带。
- 最低房价: 另一个极端是 南亚和西非国家 离婚率最低。 印度的 ~1% 离婚率很低的国家体现了强大的婚姻持久性规范。其他离婚率非常低(低于 0.5‰或<10%)的国家包括 不丹、斯里兰卡、越南、危地马拉、秘鲁和一些非洲国家.在许多这样的地方,离婚在社会上是不受欢迎的,有时在法律上也是不受欢迎的。此外,有几个州还保留了 法律禁止离婚 (菲律宾、梵蒂冈),实际上将利率保持在零。
- 地区差异: 欧洲 东部(波罗的海地区和斯拉夫国家离婚率非常高)和西部/北部(离婚率高,但略低,有 些下降)以及南部(离婚率中等,从低基数开始上升)。 北美/大洋洲 离婚率相对较高(占婚姻总数的 40-50%)。 拉丁美洲 离婚率一般为中低水平,但在合法化后有所上升。 亚洲 从东亚的高水平到南亚的最低水平,东南亚的中等水平。 非洲 除少数国家有所提高外,大部分国家的教育水平较低。这些差异往往与每个地区的主要宗教和文化历史以及发展水平有关。
- 历史性转变: 在主要国家,离婚在 20 世纪末变得更加普遍,但 "离婚热潮 "已经放缓。例如,美国和许多欧洲国家的离婚率已从高峰期开始下降,因为冲动结婚的人越来越少,人们对婚姻质量的期望也在不断提高。一些专家建议,我们可能会看到一种稳定的趋势,即现在结婚的人会更有意识地结婚,这可能会带来更持久的婚姻(从一些数据中可以看出千禧一代的离婚率在下降)。与此同时,世界其他地区(如亚洲部分地区、中东)正在 进入 随着现代化的发展,离婚率不断上升。
- 社会背景: 高离婚率本质上并无 "好 "或 "坏 "之分--它可以表明个人自由和性别平等的增强(人们可以摆脱糟糕的婚姻),但也可能反映出社会压力或支持网络的削弱。低离婚率可能表明家庭稳定、承诺坚定,但也可能表明婚姻难以维系的人缺乏选择。例如,一个社会的离婚率很低,可能掩盖了许多非正式的分居,或妇女因缺乏其他选择而忍受虐待。因此,要了解离婚统计数据,就不能只看数字,还要看 社会结构例如,瑞典的高离婚率与高生活满意度和性别平等并存,而阿富汗的低离婚率与低 女性自主权并存。
- COVID-19 的影响: 简要说明--COVID-19 大流行最初导致 2020 年离婚率下降(因为法院关闭,夫妻推迟做出决定)。一些国家(如英国、美国部分地区)在 2021-2022 年出现反弹。目前仍在研究该流行病的净影响,但它很可能 晚点 这不仅不能防止离婚,反而会导致更多的离婚。它还带来了新的压力(禁制冲突),从长远来看可能会增加一些人的离婚率。例如,中国和欧洲国家的轶事证据显示,封锁解除后,离婚申请立即激增。总之,大流行病凸显了外部事件如何暂时改变家庭动态,但核心趋势随后又会恢复。
总之、 全球离婚率是社会变革的一面镜子.处于社会快速转型期(经济发展、性别角色转变、世俗化)的国家往往离婚率上升,因为既定规范被打破,个人优先考虑个人成就。相反,在坚守传统结构的社会中--无论是出于选择还是被迫--离婚仍然很少见。随着世界的不断发展和文化价值观的演变,在一定程度上,更多国家的离婚率可能会上升。事实上,联合国指出,全世界离婚/分居的成年人比例已经增长,从 20 世纪 70 年代到 2000 年代翻了一番。不过,我们也可能看到 收敛离婚率极高的国家:离婚率极高的国家可能会趋于稳定(因为婚姻变得不那么普遍,或者随着匹配度的提高,关系得到加强),而离婚率极低的国家可能会随着态度的自由化而逐渐增加。
从政策角度来看,这些数据表明有必要在婚姻稳定与个人福祉之间取得平衡。高离婚率社会面临着支持单亲家庭和满足离婚子女需求(他们往往面临经济和情感影响)的挑战。另一方面,低离婚率社会必须考虑因社会或法律压力而陷入婚姻的个人的权利和福利。归根结底,我们的目标不是任意提高或降低离婚率,而是要确保 婚姻的缔结和解除是自由选择的结果 无论婚姻结构如何,家庭和个人都能获得所需的支持。全球的离婚情况呈现出惊人的多样性--在某些文化中,终身婚姻几乎是普遍现象,而在另一些文化中,婚姻则是一个硬币翻转的命题--这突出表明,婚姻作为最个人化的制度之一,是如何被其周围更广泛的社会所深刻塑造的。
资料来源 联合国汇编的数据 人口统计年鉴这些数据来自世界银行和经合组织的家庭数据库、国家统计机构(如欧盟国家的欧盟统计局、美国的美国疾病预防控制中心/国家卫生与健康中心)以及有关跨国离婚决定因素的学术研究。各国的结婚率和离婚率数字来自上述最新官方记录,"我们的数据世界 "提供了历史趋势可视化。这些数据来源共同确保了全球离婚模式的可信性和时效性。