Giriş ve Temel Metrikler
Eğilimler ülke ve bölgelere göre büyük farklılıklar gösterse de, boşanma son birkaç on yılda dünya genelinde giderek yaygınlaşmıştır. Küresel olarak, kaba boşanma oranı (1.000 kişi başına yıllık boşanma) 1970'lerden 2000'lere kabaca iki katına çıkmıştır. Örneğin, Avrupa Birliği'nde boşanma oranı yaklaşık 1964 yılında 1.000 kişi başına 0,8 için 2023'te 1.000'de 2,0Aynı dönemde evlilik oranları 50% oranında düşmüş olsa bile. Ancak boşanma örüntüleri tek tip olmaktan uzaktır - her ülkenin sosyal normlarını, yasal çerçevesini ve demografik eğilimlerini yansıtırlar. Boşanmayı ölçmenin iki temel yolu vardır:
- Kaba Boşanma Oranı: Belirli bir yılda 1.000 kişi başına düşen boşanma sayısı. Bu, nüfustaki yıllık boşanma sıklığını gösterir.
- Boşanma-Evlilik Oranı (Boşanma Yüzdesi): Evlilik sayısına göre boşanma sayısı, genellikle yüzde olarak ifade edilir (örneğin 100 evlilik başına boşanma). Bu yaklaşık bir rakam verir yaşam boyu risk bir evliliğin eninde sonunda boşanmayla sonuçlanacağı anlamına gelir. Örneğin, 50% oranı evliliklerin yaklaşık yarısının boşanmayla sonuçlandığını göstermektedir.
Bu ölçümleri bağlam içinde yorumlamak önemlidir. Kaba oranlar nüfusun evli olmayan kısmından veya yaş yapısından etkilenebilir. Boşanma yüzdesi yaşam boyu boşanma riskinin kaba bir tahminidir; mevcut evlilik ve boşanma örüntülerinin sabit kaldığını varsayar, ancak gerçekte yaşam boyu boşanma oranları zaman içinde evlilik kohortları takip edilerek hesaplanır. Yine de bu göstergeler birlikte boşanma yaygınlığına dair faydalı bir resim sunmaktadır.
Ülkelere Göre Boşanma İstatistikleri (Son Veriler)
Aşağıdaki tablolar, en son veri yılı, ham boşanma oranı, ham evlilik oranı ve boşanmayla sonuçlanan evliliklerin tahmini yüzdesi (boşanma/evlilik oranı) dahil olmak üzere mevcut güvenilir verilere sahip ülkeler için boşanma oranlarını sunmaktadır. Bu, boşanma yaygınlığının ülke bazında bir dökümünü sunmaktadır.
Avrupa
Avrupa, dünyanın en yüksek boşanma oranlarından bazılarını içermektedir. Birçok Avrupa ve eski Sovyet ülkesi 20. yüzyılın sonlarında boşanmalarda bir artış yaşamıştır ve şu anda evliliklerin -90%'si boşanmayla sonuçlanmaktadır. Buna karşılık, boşanmayı yakın zamanda yasallaştıran veya normalleştiren birkaç Avrupa ülkesi çok daha düşük oranlar göstermektedir.
| Ülke | Veri Yılı | Her 1.000 Kişi Başına Boşanma | 1.000 Kişi Başına Evlilik | Boşanma ile Sonuçlanan Evliliklerin %'si |
|---|---|---|---|---|
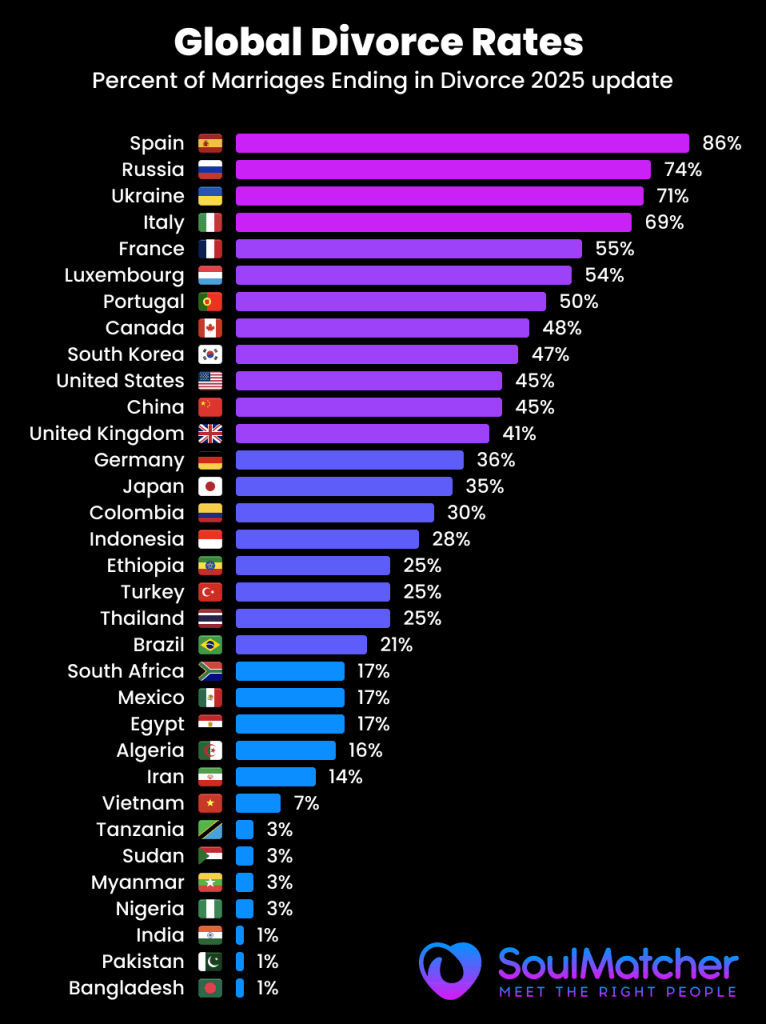
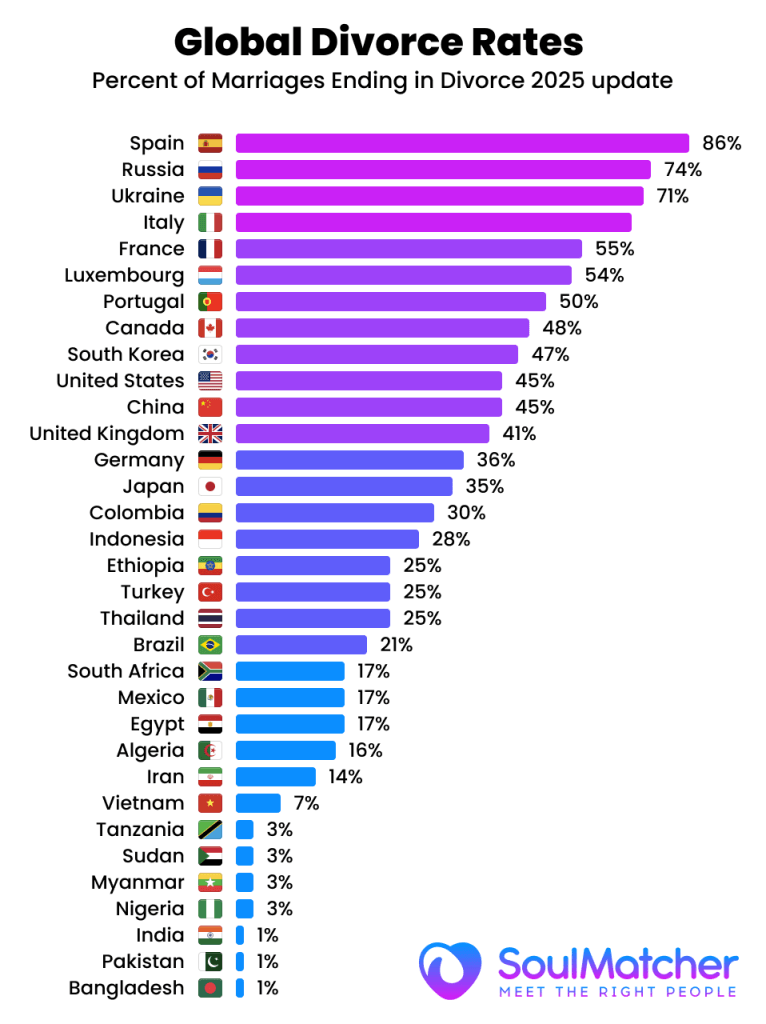
| İspanya | 2020 | 1.6 | 1.9 | 84.2% (dünya yüksekliğinde) |
| Rusya | 2020 | 3.9 | 5.3 | 73.6% |
| Ukrayna | 2020 | 2.9 | 4.1 | 70.9% |
| Fransa | 2016 | 1.9 | 3.7 | 51.3% |
| Portekiz | 2023 | 2.0 | 2.8 | 47% |
| İsveç | 2018 | 2.5 | 5.0 | 50.0% |
| İtalya | 2018 | 1.5 | 3.2 | 46.9% |
| Almanya | 2017 | 1.9 | 4.9 | 38.8% |
| Birleşik Krallık (E&W) | 2015 | 1.8 | 4.4 | 40.9% |
| Polonya | 2018 | 1.7 | 5.1 | 33.3% |
| Romanya | 2018 | 1.6 | 7.4 | 21.6% |
| İrlanda | 2017 | 0.7 | 4.6 | 15.2% |
| Malta | 2018 | 0.7 | 5.8 | 12.1% |
Avrupa: İspanya tahmin edilen Boşanma ile sonuçlanan evliliklerin 90%'sidünyadaki en yüksek oranlar arasındadır. Buna karşın, yakın zamanda boşanmaya izin veren geleneksel Katolik ülkeler (örn. Malta (2011), İrlanda (1996)) hala çok düşük boşanma oranlarına sahiptir (1.000'de 0,8'in altında) ve sadece yaklaşık 12-15% boşanmayla sonuçlanan evliliklerin oranı. Başlıca Batı Avrupa ülkeleri bu ikisinin arasında yer almaktadır: örn. 50% evliliklerin Fransa boşanmayla sonuçlanır, ~41% içinde BIRLEŞIK KRALLIKve ~39% içinde Almanya. İskandinav ülkelerinde yaklaşık 45-50% evliliklerin 'si boşanmayla sonuçlanmaktadır (örneğin İsveç ~50%). Birçok Doğu Avrupa ve eski Sovyet ülkesinde boşanma yaygınlığı yüksektir: örneğin, Rusya (74%) ve Ukrayna (71%). Bu ülkelerde Sovyet döneminde ve sonrasında boşanma oranlarında artışlar görülmüştür. Bu arada, birkaç Doğu Avrupa ülkesi daha düşük oranlara sahiptir (Romanya ~22%, geleneksel olarak daha muhafazakar normlar nedeniyle). Genel olarak, Avrupa'nın kaba boşanma oranları çoğunlukla yaklaşık 1.000'de 1 ila 3Medyan değer 1.000'de 1,5-2,5 civarındadır, ancak boşanma-evlenme yüzdeleri farklı evlilik oranları nedeniyle büyük ölçüde değişmektedir. Avrupa'da boşanmalardaki uzun vadeli artışın bir kısmı yasal değişikliklerden kaynaklanmıştır - İtalya (1970), İspanya (1981), İrlanda (1996) ve Malta'da (2011) boşanma yasallaşmış ve bu ülkelerde zaman içinde boşanma sayılarının artmasına katkıda bulunmuştur.
Kuzey Amerika
Kuzey Amerika'da da boşanma oranları nispeten yüksektir, ancak son zamanlarda bazı bölgelerde düşüş eğilimi görülmektedir.
| Ülke | Veri Yılı | Her 1.000 Kişi Başına Boşanma | Her 1,000 kişi başına evlilik | Boşanma ile Sonuçlanan Evliliklerin %'si |
|---|---|---|---|---|
| Birleşik Devletler | 2020 | 2.3 | 5.1 | 45.1% |
| Kanada | 2008 | 2.1 | 4.4 | 47.7% |
| Küba | 2010 | 2.9 | 5.2 | 55.8% |
| Meksika | 2020 | ~1.0 | ~5.5 (tahmini) | ~20% (tahmini) |
| Şili | 2009 | 0.7 | 3.3 | 21.2% |
| Guatemala | 2019 | (çok düşük) | (yüksek) | ~5% (tahmini) |
Kuzey Amerika: Bu Birleşik Devletler uzun zamandır büyük ülkeler arasında en yüksek kaba boşanma oranlarından birine sahiptir (1980'lerin başında 5.0'a yaklaşmıştır). 2000 yılında ABD'de bu oran 1.000'de 4,0'tü, ancak o zamandan bu yana 1.000'de 2,3 2020 itibariyle. Bugün yaklaşık 42-45% ABD'de evliliklerin 'sinin boşanmayla sonuçlandığı tahmin edilmektedir. Komşu Kanada kabaca benzerdir 48% boşanmayla sonuçlanan evliliklerin oranı (~2008 itibariyle). Karayipler ve Orta Amerika'da, Küba son derece yüksek bir boşanma oranına sahiptir - yaklaşık 56% evliliklerin boşanmayla sonuçlanması, buradaki boşanmanın tarihsel kolaylığını yansıtmaktadır. Buna karşın, Meksika'nin kaba boşanma oranı (~1.0) oldukça düşüktür; güçlü aile gelenekleri nedeniyle, sadece tahmini 20-25% Meksika'da evliliklerin 'si boşanmayla sonuçlanmaktadır (son verilere dayanarak yapılan tahmin). Birçok Latin Amerika ülkesi tarihsel olarak çok düşük boşanma oranlarına sahipti (bazı durumlarda boşanma yakın zamana kadar yasaklandığı veya yaygın olmadığı için). Örneğin, Şili sadece 2004 yılında boşanmayı yasallaştırmıştır ve 2009 yılı itibariyle hala düşük bir orana sahiptir (1.000'de 0,7, evliliklerin ~21%'si). Genel olarak, boşanma 21. yüzyılda Latin Amerika'da artmaktadır, ancak kültürel normlar oranları ılımlı tutmaktadır - Orta Amerika'daki birçok ülke (örneğin Guatemala, Honduras) 1.000 kişi başına 1'in altında boşanma bildirmektedir, bu da evliliklerin 10%'sinin yasal boşanma ile sonuçlandığını göstermektedir (ancak gayri resmi ayrılıklar daha yüksek olabilir).
Asya
Asya'da en geniş aralık Farklı kültürleri ve yasaları yansıtan boşanma oranları. Bazı Doğu Asya ve Avrasya ülkeleri en yüksek boşanma yaygınlığına sahipken, Güney Asya en düşük boşanma yaygınlığına sahiptir.
| Ülke | Veri Yılı | Her 1.000 Kişi Başına Boşanma | Her 1,000 kişi başına evlilik | Boşanma ile Sonuçlanan Evliliklerin %'si |
|---|---|---|---|---|
| Çin | 2018 | 3.2 | 7.2 | 44.4% |
| Güney Kore | 2019 | 2.2 | 4.7 | 46.8% |
| Japonya | 2019 | 1.7 | 4.8 | 35.4% |
| İsrail | 2009 | 1.8 | 6.5 | 27.7% |
| Suudi Arabistan | 2020 | 2.1 | 5.6 | 37.5% |
| Kazakistan | 2021 | 2.5 | 7.3 | 34.3% |
| Türkiye | 2018 | 1.7 | 6.8 | 25.0% |
| Vietnam | 2015 | 0.4 | 5.7 | 7.0% |
| Hindistan | ~2018 | 0.1 | ~10 | ~1% (en düşük) |
| Filipinler | N/A | yasa dişi boşanma | - | 0% (yasal yasak) |
Asya: Birkaç Doğu Asya ülkeler hızlı bir sosyal değişim geçirmiş ve artık yüksek boşanma oranlarına sahiptir. Güney Kore'nin boşanma oranı 1990-2000'lerde dramatik bir şekilde arttı ve 2019 itibariyle yaklaşık 47% evliliklerin çoğu boşanmayla sonuçlanıyordu. Çin'nin boşanma oranı da benzer şekilde 2000'li yıllarda yaklaşık 1.000'de 3,2 (evliliklerin 44%'si) 2018 itibariyle kentleşmeyi ve boşanma prosedürlerinin kolaylaştırılmasını yansıtmaktadır - aslında, Çin'deki boşanma sayısı 2019'a kadar 16 yıl boyunca her yıl artmıştır. (2021'de yeni bir "soğuma" yasası Çin'deki boşanma başvurularında ani bir düşüşe neden oldu, ancak bunun kalıcı olup olmayacağı veya sadece boşanmaları geciktirip geciktirmeyeceği tartışılıyor). Japonya Japonya'da boşanma oranı 2002 yılında en yüksek seviyesine ulaşmış ve daha sonra düşüşe geçmiştir. 2019 yılı itibariyle Japonya'da bu oran 1.000'de 1,7'dir ve kabaca 35% boşanmayla sonuçlanıyor. İçinde Güneydoğu Asyaboşanma oranları, kısmen dini ve kültürel normlar nedeniyle orta ila düşük olma eğilimindedir. Örneğin, Vietnam sadece raporlar 1.000 kişi başına 0,4 boşanma ve ~7% boşanmayla sonuçlanıyor. Endonezya Ayrıca yüksek Müslüman nüfusuna rağmen düşük bir kaba boşanma oranına (~1,2) sahiptir (İslam boşanmaya izin vermektedir ancak uygulamada nadiren görülmektedir). Güney Asya dünyadaki en düşük boşanma oranına sahiptir - Hindistan'ın kaba boşanma oranı sadece yaklaşık 1.000'de 0,1ve sadece 1% civarında Hindistan'da evliliklerin 'ı yasal boşanma ile sonuçlanmaktadır. Bu son derece düşük oran, Hindistan'da boşanmaya karşı güçlü sosyal damgalama, geniş aile baskısı ve yasal engellere bağlanmaktadır. Diğer Güney Asya ve Orta Doğu ülkeleri de çok düşük boşanma oranları bildirmektedir (örn. Sri Lanka 1,000'de ~0.15, evliliklerin yüzde birkaçı). Öte yandan, Orta Doğu'nun bazı bölgelerinde daha yüksek boşanma oranları: örneğin, Suudi Arabistan ve Kazakistan (Müslümanların çoğunlukta olduğu bir Orta Asya ülkesi) her ikisi de 30-40% evliliklerin büyük bir kısmı boşanmayla sonuçlanmaktadır. Körfez ülkelerinde boşanma nispeten yaygındır - örn. Kuveyt 2010 yılında 42% civarındaydı - kadınlar daha fazla engelle karşılaşsa da erkekler için izin verici yasalar bunu kolaylaştırdı. Özellikle, Filipinler (ve Vatikan) tek ülkeler olarak öne çıkmaktadır boşanmanın tamamen yasadışı olduğusonuç olarak esasen 0% Evliliklerin yasal olarak boşanmayla sonuçlanması (fesih mümkündür ancak nadirdir). Bu tür yasal yasaklar, ayrılıklar meydana gelse bile kayıtlı boşanma oranını sıfırda tutmaktadır.
Afrika
Afrika'da güvenilir boşanma istatistikleri seyrektir, ancak mevcut veriler bazı istisnalar dışında genellikle daha düşük boşanma oranlarına işaret etmektedir. Birçok Afrika evliliği geleneksel veya dini olup resmi hukuk sistemi dışında çözülebilmektedir, bu da resmi boşanma sayılarını düşük kılmaktadır.
| Ülke | Veri Yılı | Her 1.000 Kişi Başına Boşanma | Her 1,000 kişi başına evlilik | Boşanma ile Sonuçlanan Evliliklerin %'si |
|---|---|---|---|---|
| Güney Afrika | 2009 | 0.6 | 3.5 | 17.1% |
| Mısır | 2021 | 2.4 | (tahmini ~9) | ~25% (tahmini) |
| Mauritius | 2010 | 1.4 | 8.2 | 17.1% |
| Nijerya | ~2016 | (çok düşük) | (yüksek) | (<5%) (tahmini) |
| Fas/Cezayir | ~2018 | ~1-1.5 | ~7-8 | ~15-20% (tahmini) |
Afrika: Birçok Afrika ülkesinde Kaba boşanma oranı 1.000'de 1'in altındaBu da nispeten az sayıda resmi boşanmaya işaret etmektedir. Örneğin, Güney Afrika - daha iyi belgelenmiş vakalardan biri - sadece 1.000 kişi başına 0,6 boşanma 2009 yılında, yaklaşık 17% boşanmayla sonuçlanan evliliklerin oranı. Afrika'nın bazı bölgelerinde boşanmanın sosyal/dinsel açıdan güçlü bir şekilde onaylanmaması, gayriresmi ayrılıkların veya mahkemede sonuçlanmayan çok eşli birlikteliklerin yaygınlığı ve boşanma elde etmenin pratik zorlukları (özellikle kadınlar için) gibi çeşitli faktörler kaydedilen düşük oranlara katkıda bulunmaktadır. İslami hukukun evliliği etkilediği Kuzey Afrika ve Orta Doğu'da boşanmaya yasal olarak izin verilmekle birlikte genellikle şartlara bağlanmıştır. MısırÖrneğin, son yıllarda boşanma sayıları artmıştır (2021'de 1.000'de 2,4) - Afrika'daki en yüksek oranlardan biri - çünkü tutumlar yavaş yavaş değişmektedir, ancak kadınların boşanmayı başlatmak için genellikle mali haklardan feragat etmeleri gerekmektedir. Diğer Afrika ülkeleri ise Mauritius (17%) ve Fas (~15-20%) orta düzeyde boşanma/evlenme oranlarına sahiptir. Genel olarak Afrika toplumları evlilikte istikrara önem verir ve birçok boşanma resmi istatistikler olmadan gerçekleşir (örneğin toplum büyükleri aracılığıyla). Sahra altı Afrika'nın bazı bölgelerinde sendikal istikrarsızlık yüksek olabilir (sosyoekonomik stres veya dulluk gibi faktörler nedeniyle), ancak bunlar verilerde her zaman "boşanma" olarak kaydedilmemektedir. Verilerin mevcut olduğu yerlerde genellikle bir örüntü görülmektedir: kentsel ve eğitimli nüfus kırsal nüfusa kıyasla daha yüksek boşanma oranlarına sahiptir ve bu durum çiftlerin ayrılma konusunda daha fazla özerkliğe sahip olduğunu yansıtmaktadır.
Okyanusya
Okyanusya'nın boşanma örüntüleri Batı ülkeleriyle benzerlik göstermektedir.
| Ülke | Veri Yılı | Her 1.000 Kişi Başına Boşanma | Her 1,000 kişi başına evlilik | Boşanma ile Sonuçlanan Evliliklerin %'si |
|---|---|---|---|---|
| Avustralya | 2020 | 1,9 (tahmini) | 4,6 (tahmini) | ~41% |
| Yeni Zelanda | 2020 | 1,5 (tahmini) | 3,6 (tahmini) | ~42% |
| Fiji / Pasifik Adaları | ~2018 | (düşük) | (değişir) | (10-20%) (tahmini) |
Okyanusya: Avustralya ve Yeni Zelanda Avrupa ve Kuzey Amerika ile karşılaştırılabilir boşanma oranlarına sahiptir. Kabaca 40-45% Avustralya ve Yeni Zelanda'daki evliliklerin yüzde 20'sinin boşanmayla sonuçlanması beklenmektedir. Örneğin, Yeni Zelanda'da kaba boşanma oranı 2022'de 1.000'de 1,6'dır ve o yıl mevcut 1.000 evli çift başına yaklaşık 7,6 boşanma olmuştur - bu da yaklaşık 40%'lik benzer bir boşanma riski anlamına gelmektedir. Her iki ülkede de 20. yüzyılın sonlarına doğru boşanmalarda artış görülmüştür, ancak son yıllarda evlilik oranları düştükçe oranlar sabitlenmiş veya hafifçe azalmıştır. Buna karşılık, birçok küçük Pasifik Adası ülkesi (Fiji, Samoa, vb.) daha muhafazakar aile yapılarına ve sınırlı verilere sahiptir, ancak anekdot niteliğindeki kanıtlar nispeten düşük boşanma sıklığına işaret etmektedir (genellikle 1.000'de 1'in altında).
Tablo Notları: Veriler mevcut en son yılı yansıtmaktadır (parantez içinde). "Boşanmayla sonuçlanan evliliklerin %'si" o yıl için boşanmalar ÷ evlilikler × 100 olarak hesaplanmıştır (yaşam boyu boşanma riskinin üst düzey bir tahmini). Gerçek yaşam boyu boşanma olasılıkları, özellikle hızlı değişim geçiren ülkelerde biraz farklılık gösterebilir. Yine de bu yüzde faydalı bir karşılaştırmalı göstergedir. Bu rakamlar için Birleşmiş Milletler Nüfus Yıllığı ve ulusal istatistik kurumları gibi yetkili kaynaklara atıfta bulunuyoruz. Genel olarak, küresel boşanma oranları 1.000'de 0,5'in altından (boşanmanın az olduğu birkaç toplumda) en yüksek ülkelerde 1.000'de 3-4 civarına kadar değişmektedirBoşanmayla sonuçlanan evliliklerin oranı ise 5%'nin altından 90%'nin üzerine kadar değişmektedir ki bu da yasal ve kültürel uç noktaları yansıtan şaşırtıcı bir aralıktır.
Dünya Çapında En Yüksek ve En Düşük Boşanma Oranları
Küresel olarak en yüksek kaba boşanma oranları (1.000 kişi başına) eski Sovyet ülkeleri, Avrupa'nın bazı bölgeleri ve diğer birkaç bölgenin karışımında görülmektedir. En son BM verilerine göre, en yüksek yıllık boşanma oranları şunlardır:
- Kuzey Makedonya: 1.000 kişi başına 9,6 boşanma (2023) - son zamanlarda yaşanan bir artış bu küçük Balkan ülkesini zirveye taşıdı. (2023'teki bu alışılmadık derecede yüksek oran, pandemi sonrası işlenen boşanmaların birikmesinden veya diğer anormalliklerden kaynaklanıyor olabilir).
- Maldivler: 1.000'de 5,5 (2020) - Maldivler tarihsel olarak çoklu evliliklere ilişkin kültürel normlara atfedilen son derece yüksek boşanma oranlarına sahipti (2002'de 1.000 kişi başına 10,97 ile Guinness Dünya Rekoru'na ulaştı). Son yıllarda bile 1.000 kişi başına 5'ten fazla boşanma ile dünyada başı çekmektedir.
- Belarus, Gürcistan, Moldova: etrafında 1,000'de 3.7-3.8 (2021-2022). Bazı eski SSCB cumhuriyetleri, Sovyet sonrası dönemdeki yüksek toplumsal boşanma kabulünü ve ekonomik stresleri yansıtarak listenin başında yer almaktadır. Örneğin, Belarus'ta her 1.000 kişide 3,7 ve Moldova'da 3,7 boşanma gerçekleşmiştir.
- Letonya, Litvanya: ~1.000'de 2,5-2,9 (2022). Baltık ülkeleri sürekli olarak yüksek boşanma oranlarına sahiptir; Letonya 2,8 ile AB'deki en yüksek boşanma oranına sahiptir.
- Birleşik Devletler: 1,000'de ~2.3 (2020) - ABD eskiden en üst sıralarda yer alırken, oranı düşmüştür ve şu anda Doğu Avrupa ile karşılaştırıldığında orta düzeydedir.
Açısından "yaşam boyu" boşanma riski (boşanmayla sonuçlanan evliliklerin payı)liderler biraz farklıdır ve bazı yerlerdeki düşük evlilik oranlarının etkisini vurgulamaktadır. Boşanma yüzdesi en yüksek ülkeler şunlardır:
- İspanya: ~85% evliliklerin çoğu boşanmayla sonuçlanmaktadır. Boşanmanın 1981'de yasallaşmasının ardından İspanya'da boşanma oranı hızla yükselmiş ve nispeten az sayıda yeni evlilikle birlikte boşanma oranı son verilerde son derece yüksek çıkmıştır.
- Rusya: 73-74%; Ukrayna: ~71%; Belarus: ~60-65% (tahmini). Bu Slav ülkelerinde evlilik devir hızı yüksektir - çok sayıda evlilik vardır, ancak bu sayıya oranla boşanmalar daha da fazladır.
- Küba: ~56%; Fransa: ~51%; İsveç: 50%. Birçok Batı ülkesi 50% sınırı etrafında kümelenmektedir, yani evliliklerin kabaca yarısı eninde sonunda sona ermektedir (sık sık dile getirilen "tüm evliliklerin yarısı boşanmayla sonuçlanmaktadır" ifadesi ABD, Fransa, Birleşik Krallık vb. için kabaca doğrudur).
Buna karşılık en düşük boşanma oranları boşanmanın önünde yasal veya kültürel engeller olan toplumlarda bulunur. Bunlar şunları içerir:
- Hindistan: Sadece yaklaşık 1% evliliklerin çoğu boşanmayla sonuçlanmaktadır. Hindistan'daki kaba boşanma oranı (~0,1) her yerde kaydedilen en düşük oranlardan biridir. Güçlü damgalama ve evliliğe katlanma beklentisi çok az boşanmayla sonuçlanmaktadır.
- Bhutan, Sri Lanka, Vietnam: Sadece 5-7% evliliklerin 'si boşanmayla sonuçlanmaktadır. Bu Asya ülkelerinde kaba oranlar her 1.000 kişide 0,5'in çok altındadır. Örneğin Sri Lanka'da bu oran 0,15'tir ve boşanma genellikle uzun yasal süreçler gerektirmektedir.
- Kolombiya ve birçok Afrika ülkesi: Sık sık 10-20% boşanma olasılığı. Güçlü Katolik veya cemaat etkisine sahip birçok Afrika ve Latin Amerika ülkesi (örneğin Guatemala, Kongo, Nijerya) çok düşük boşanma sayıları bildirmektedir.
- Filipinler ve Vatikan Şehri: 0% (yasal boşanma yok). Filipinler'de evlilikler yalnızca fesih veya ölüm yoluyla sona erdirilebilir. Şaşırtıcı olmayan bir şekilde, resmi boşanma oranı fiilen sıfırdır ve ülke genellikle küresel boşanma sıralamasında en alt sıralarda yer almaktadır.
Şekil: Dünya boşanma yaygınlığı haritası ("ülkelere göre boşanma olasılıkları"). Daha sıcak renkler (kırmızı) daha yüksek boşanma oranlarını veya olasılığını gösterirken daha soğuk renkler (yeşil) daha düşük boşanma oranlarını göstermektedir. Gri, yetersiz veriyi göstermektedir. Bu harita boşanmanın en çok eski SSCB, Avrupa'nın bazı bölgeleri ve Kuzey Amerika'da yaygın olduğunu, en az ise Güney Asya, Afrika'nın bazı bölgeleri ve bazı Güneydoğu Asya ülkelerinde yaygın olduğunu vurgulamaktadır.
Harita ve verilerin gösterdiği gibi, boşanma oranlari bölgeler arasinda büyük farkliliklar gösteri̇yor. Genel olarak, gelişmiş bölgeler ve daha liberal sosyal normlara sahip bölgeler (Avrupa, Kuzey Amerika, Okyanusya) daha yüksek boşanma oranlarına sahipken, daha geleneksel veya kısıtlayıcı normlara sahip gelişmekte olan bölgeler (Güney Asya, Orta Doğu, Afrika) daha düşük oranlara sahiptir. Bununla birlikte, dikkate değer istisnalar da vardır - örneğin, daha zengin Doğu Asya ülkeleri (Japonya, Kore) ılımlı oranlara sahiptir ve bazı yoksul ülkeler (eski Sovyet alanındakiler gibi) benzersiz tarihsel faktörler nedeniyle yüksek oranlara sahiptir. Kültürel tutumlar, din ve yasal yapılar, ileride tartışılacağı üzere, bu sonuçları büyük ölçüde etkilemektedir.
Başlıca Ülkelerde Tarihsel Boşanma Eğilimleri
Birçok ülkede boşanma oranları ters U şekli Son 50 yılı aşkın bir süre boyunca, 1970-1990'larda keskin bir yükseliş, ardından 2000'lerde plato çizme veya düşüş. Zirvenin zamanlaması ve yüksekliği ülkeden ülkeye değişmekte, farklı sosyal değişimleri yansıtmaktadır. Aşağıdaki Şekil 1, kıtalardan seçilen bazı ülkeler için boşanma oranı eğilimlerini göstermekte ve bu farklı örüntüleri vurgulamaktadır.
Şekil 1: Seçilmiş ülkeler için boşanma oranı eğilimleri (yılda 1.000 kişi başına boşanma), 1960-2020. Birçok Batı ülkesi (örn. Birleşik Devletler, Birleşik Krallık, Norveç) boşanma oranlarının 1960'lardan itibaren yükseldiğini, 1970-1980'lerde zirve yaptığını ve ardından düşüşe geçtiğini görmüştür. Bazı Doğu Asya ve Doğu Avrupa ülkeleri (Güney Kore, Estonya, Polonya) daha sonra (2000'lerin başında) boşanmanın daha fazla kabul görmesiyle zirve yapmıştır. Diğerleri ise Türkiye düşük bir tabandan 2010'lara doğru istikrarlı bir artış göstermektedir. (Veri kaynağı: OECD/UN, Our World in Data aracılığıyla)
İçinde Birleşik DevletlerKaba boşanma oranı 1960 yılında ~2,2 iken, hatasız boşanma yasalarının yürürlüğe girmesi ve değişen toplumsal cinsiyet rollerinin ardından 1981 yılında tüm zamanların en yüksek seviyesi olan 1.000'de 5,3'e yükselmiştir. O zamandan bu yana bu oran istikrarlı bir şekilde düşmüştür - 2021'de son 50 yılın en düşük seviyesi olan 2,5'e gerilemiştir. Bu düşüş kısmen genç nesillerin daha geç ve daha seçici bir şekilde evlenmesine ve bunun sonucunda daha istikrarlı evliliklerin ortaya çıkmasına bağlanıyor. ABD'de ilk evlilikler için boşanma riski bir miktar düşmüştür (şu anda genel olarak 40-45% civarında olduğu tahmin edilmektedir). Benzer şekilde, Kanada ve Avustralya 1980'lerde zirve yapmış ve sonrasında düşüşe geçmiştir. Örneğin, Avustralya'nın boşanma oranı 1975'te hatasız boşanma başladıktan sonra yükselmiş, ardından istikrar kazanmıştır; Avustralya'da boşanmayla sonuçlanan evliliklerin yüzdesi aslında aşağı 1980'lerde yaklaşık 50%'den bugün ~41%'ye çıkmıştır.
İçinde Batı Avrupaçoğu ülkede 1970 ve 1990 yılları arasında boşanma oranlarında artış görülmüştür. Boşanma BIRLEŞIK KRALLIK 1990'ların ortalarında 1.000 kişi başına ~3 boşanma ile zirve yapmış (1990'larda boşanmaları kolaylaştıran reformun ardından) ve o zamandan beri ~1,8'e düşmüştür. İskandinav ülkeler en erken artış gösteren ülkeler arasındadır (örneğin İsveç 1980'lerde 1.000'de ~2,5'e ulaşmıştır ve halen 2,0-2,5 civarındadır). Güney Avrupa İtalya, İspanya, Portekiz gibi ülkelerde boşanma yasal hale gelene kadar boşanma oranları çok düşüktü (İspanya 1981, Portekiz 1975, İtalya 1970). Yasallaşmanın ardından bu ülkelerde ciddi artışlar görülmüştür: İspanya'nın boşanma oranı özellikle 2005 yılında çıkarılan bir yasayla prosedürlerin kolaylaştırılmasının ardından sıçrama göstermiş ve bu da mevcut yüksek boşanma oranlarına katkıda bulunmuştur. Portekiz'de de boşanmalar 1990-2000'li yıllarda hızla artmıştır. İlginç bir şekilde, bazı Batı ülkelerinde son zamanlarda azalan boşanma oranları: örn. Almanya, Hollanda, Fransa 2000'lerin başından bu yana kaba boşanma oranlarında hafif düşüşler yaşamıştır. Bu durum genellikle ilk etapta daha az kişinin evlenmesine (dolayısıyla daha az kişinin boşanmasına) ve muhtemelen daha fazla birlikte yaşama ve daha yüksek evlilik yaşına (boşanma riskini azaltan) bağlanmaktadır. Boşanma Bir bütün olarak AB boşanma oranının 2006 yılında 2,1 ile zirve yaptığını ve ardından 2019 yılına kadar küçük bir düşüşle 1,8-2,0 seviyesine gerilediğini görmüştür.
İçinde Doğu Avrupa ve eski SSCB1990'lardaki geçiş, çok yüksek boşanma oranlarına yol açmıştır. Rusya ve Ukrayna Sovyet sonrası dönemin sosyal çalkantılarını ve yeni özgürlüklerini yansıtacak şekilde, 1990-2000'lerde 1.000'de 4-5 civarında ham oranlarla zirve yapmıştır. Rusya'nın oranı o zamandan beri yaklaşık 3,9'a (2020 itibariyle) gerilemiştir, ancak evliliklere göre yüksek kalmaya devam etmektedir. Baltık ülkelerinin (Estonya, Letonya, Litvanya) hepsinde 1990'ların sonunda boşanma oranları yükselmiş ve yüksek kalmaya devam etmiştir (Letonya'nın 2023'teki 2,8'lik oranı Avrupa'daki en yüksek oranlardan biridir). Bazı Doğu Avrupa ülkelerinde son zamanlarda boşanma eğilimleri azalmaktadır (ör. Polonya 2006 civarında zirve yapmış ve daha sonra hafifçe düşmüştür), muhtemelen aile üzerindeki kültürel vurgu ve gençler arasında daha az evlilik nedeniyle (Polonya hala Avrupa'nın en yüksek evlilik oranlarından birine sahiptir).
Asya'nın trendler çeşitlilik göstermektedir. Japonya'nın Dünya Savaşı'ndan sonra kademeli olarak artmış, 2002'de ~2,1'e ulaşmış ve daha sonra nüfus yaşlandıkça ve daha az genç evlendikçe 2019'a kadar ~1,6-1,7'ye düşmüştür. Güney Kore daha sonra ancak daha keskin bir artış göstermiştir: 1990'da 1,1 olan boşanma oranı 2003'te ~3,5'e yükselerek üçe katlanmış, 2010'da ~2,2'ye düşmüş ve daha sonra dengelenmiştir. Kore ve Japonya'daki bu örüntü - bir zirve ve ardından düşüş - kısmen kuşak değişimleriyle açıklanmaktadır (1980-90'larda evlenen kohort yüksek boşanma oranlarına sahipti, ancak daha genç kohortlar daha az evleniyor ve biraz daha istikrarlı). Çin 2000'li yıllar boyunca boşanmalardaki istikrarlı artış dikkat çekicidir: 1980'lerde çok düşük olan Çin'in ham boşanma oranı 2018'de 3,2'ye ulaşmıştır. Çin hükümetinin 2021 yılında 30 günlük bekleme süresini uygulamaya koyması, hemen ardından kayıtlı boşanmalarda 70%'lik bir düşüşe yol açmıştır, ancak bu gerçek bir davranış değişikliğinden ziyade gecikmiş veya kayıt dışı ayrılıkları gösteriyor olabilir (bazı Çinli çiftler boşanmak için acele etmiştir). önce 2020 rakamlarında artış, ardından 2021'de düşüş). Uzun vadede Çin'deki eğilim, artan bireyciliği ve kentsel alanlarda boşanmaya ilişkin damgalamanın azaldığını yansıtmaktadır. İçinde HindistanBuna karşılık, boşanma oranı zaman içinde sürekli olarak çok düşük kalmıştır - karşılaştırılabilir bir "boşanma patlaması" yoktur ve tarihsel damgalama oranları sıfıra yakın tutmuştur (ancak kentsel Hindistan'da son yıllarda boşanmalarda yavaş bir artış görülmektedir).
Birçok Orta Doğu ve Kuzey Afrika ülkelerde uzun vadeli veriler bulunmamaktadır, ancak bazıları (örneğin Mısır ve Ürdün) 2010'larda muhtemelen kademeli sosyal değişimler ve yasal reformlar nedeniyle artan boşanma sayıları göstermektedir. Örneğin, Mısır'ın boşanma oranı 2010'lar boyunca artarak 2021'de en yüksek seviyeye ulaşmıştır (1.000'de 2,4). Körfez ülkeleri BAE, Katar ve Kuveyt gibi ülkelerde 1990-2000'li yıllarda boşanma oranlarının yüksek olduğu (Katar 2005 yılında 1.000'de 2,2 ile zirve yaparken Kuveyt'te bu oran daha da yüksektir) ve ardından bir miktar istikrar sağlandığı bildirilmektedir. Bu eğilimler genellikle modernleşme ve kadınların eğitiminin artmasıyla aynı döneme denk gelmekte ve mutsuz evlilikleri sonlandırma konusunda daha istekli olmalarına yol açmaktadır.
İçinde Afrikatarihsel veriler sınırlıdır. Ancak anekdotsal kanıtlar, bazı Güney Afrika ülkelerinde boşanmanın 2000 sonrasında daha yaygın hale geldiğini göstermektedir (örn. Botsvana ve Güney Afrika 1990'larda artışlar görmüş, daha sonra hafif düşüşler yaşamıştır). Güney Afrika'da kayıtlara geçen boşanmalar 2004 yılından bu yana yavaş yavaş azalmıştır, bunun nedeni muhtemelen daha az resmi evlilik ve daha fazla birlikte yaşamadır. Buna karşılık, aşağıdaki gibi ülkeler Etiyopya veya Nijerya tarihsel olarak hala çok düşük resmi boşanma oranlarına sahiptir, ancak ayrılma oranları daha yüksek olabilir.
Özetle, başlıca gelişmiş ülkeler "boşanma devriminin" zirvesini çoğunlukla geride bırakmıştır - 20. yüzyılın sonlarında tırmanışa geçen boşanma oranları 21. yüzyılda durağanlaşmış ya da düşmeye başlamıştır. Gelişmekte olan ülkeler farklı aşamalardadır: bazıları (özellikle Doğu Asya, Latin Amerika'nın bazı bölgeleri) 2000'li yıllarda boşanma artışını yaşamış ve şu anda dengelenmekte iken, diğerleri (Güney Asya, Afrika'nın bazı bölgeleri) kalıcı kültürel kısıtlamalar nedeniyle henüz önemli artışlar görmemiştir.
Bölgesel ve Ekonomik Örüntüler
Karşılaştırma yaparken kıtalar ve ekonomik gruplarboşanma yaygınlığında net örüntüler ortaya çıkmaktadır:
- Avrupa ve Kuzey Amerika: Bu yüksek gelirli bölgeler orta ila yüksek boşanma oranları. OECD yüksek gelirli ülkelerindeki ortalama kaba boşanma oranı yaklaşık 1.000'de 1,8 son yıllarda. Avrupa'da AB ortalaması ~2,0'dır. Neredeyse tüm Batı ülkeleri hatasız boşanmaya izin vermekte ve asgari yasal engellere sahiptir, bu da önemli boşanma seviyeleri ile sonuçlanmaktadır. Ancak bu grup içinde de farklılıklar mevcuttur: Kuzey ve Batı Avrupa'da (ve Kuzey Amerika/Okyanusya'da) boşanma oranları 40-50% civarındayken, geleneksel olarak Katolik veya Ortodoks olan ülkelerde (İrlanda, Polonya, İtalya) bu oranlar yükselmekle birlikte daha düşüktür. Ekonomik kalkınma ve kentleşme Kadınların mali bağımsızlığı ve sosyal güvenlik ağları evlilikten ayrılmayı daha uygulanabilir hale getirdiğinden, boşanma oranları daha yüksek olma eğilimindedir. Gerçekten de araştırmalar, kadınların eğitiminin ve işgücüne katılımının daha yüksek olduğu ülkelerde boşanma oranlarının genellikle daha yüksek olduğunu ortaya koymuştur. Bu durum, örneğin İskandinavya (yüksek toplumsal cinsiyet eşitliği, nispeten yüksek boşanma) ile daha az gelişmiş bölgeler arasında belirgindir. Aynı zamanda, aşırı yüksek boşanma sıklığı aşağıdaki durumları da yansıtabilir sosyal bozulma - Örneğin, Rusya ve komşuları (üst-orta gelirli ülkeler) sosyo-ekonomik zorluklar ve dinin politika üzerindeki etkisinin daha zayıf olması nedeniyle boşanma oranlarında birçok zengin ülkeden daha iyi performans göstermektedir.
- Asya: Asya genellemeye meydan okuyor çünkü hem bazı en düşük ve en yüksek boşanma toplumları. Genel olarak, Doğu Asya ve Orta Asya ülkeler (örneğin Kore, Çin, Kazakistan) artık Batı ülkeleriyle karşılaştırılabilir boşanma oranlarına sahiptir. Buna karşın, Güney Asya (Hindistan, Bangladeş, Pakistan) kültürel normlar (ataerkil aile sistemleri, damgalama, görücü usulü evlilik gelenekleri) nedeniyle boşanma oranı son derece düşüktür. Güneydoğu Asya Endonezya ve Malezya gibi ağırlıklı olarak Müslüman olan ülkelerde kayıtlara geçen boşanmalar düşüktür, ancak İslam hukuku erkeklerin nispeten daha kolay boşanmasına izin vermektedir (bu da gayri resmi boşanmaları artırabilir). Bu bölgelerde aile bütünlüğü ve boşanmaya ilişkin toplumsal utanç, oranları düşük tutmaktadır. Örneğin, Vietnam ve Tayland oranlarının düşük olmasının nedeni, geniş ailenin genellikle evlilik sorunlarına aracılık etmesidir. Ekonomik faktörler Asya'daki yoksul tarım toplumlarında boşanma oranı daha düşüktür çünkü aile ekonomik bir birimdir ve kadınlar evlilik dışında destekten yoksun olabilir. Ancak ekonomiler büyüdükçe ve kadınlar fırsatlar elde ettikçe boşanmalar artma eğilimi göstermektedir (örneğin kentsel Çin'de boşanmalardaki hızlı artış ekonomik liberalleşme ile aynı zamana denk gelmiştir). Özellikle, kısıtlayıcı boşanma yasalarına (şimdiye kadar Filipinler gibi) veya uzun süreli ayrılık şartlarına sahip ülkeler doğal olarak düşük oranlar göstermektedir.
- Orta Doğu ve Kuzey Afrika: Bu bölge, önemli değişkenlik gösteren orta düzeyde boşanma oranlarına sahiptir. Genel olarak, Körfez Arap ülkeleri (örneğin Kuveyt, Katar, BAE) ve Kuzey Afrika ülkeleri 1.000'de 1-2 civarında kaba oranlar bildirmiştir - Avrupa kadar yüksek değil, ancak Güney Asya'dan daha yüksek. Kültürel normlar kadınları boşanmayı başlatmaktan şiddetle caydırmaktadır, ancak erkeklerin (İslam hukukunda) eşlerini reddedebilmesi erkeklerin başlattığı boşanma oranlarının daha yüksek olmasına yol açabilmektedir. Toplumsal cinsiyet eşitsizliği rol oynamaktadır: ironik bir şekilde, cinsiyet eşitsizliğinin yüksek olduğu bazı Orta Doğu ülkeleri Ayrıca nispeten yüksek boşanma oranlarına sahiptir (çünkü erkekler özgürce boşanabilirken kadınlar sonuçlarına katlanmaktadır). Buna karşılık Yemen veya Suriye gibi yerlerde boşanma oranlarının çok düşük olması hem toplumsal baskıyı hem de kadınların boşanma konusunda karşılaştıkları zorlukları yansıtıyor olabilir. Son yıllarda modernleşme, yasal reformların boşanmayı kolaylaştırması ve kadınların daha eğitimli hale gelmesiyle birlikte bölgenin daha liberal kesimlerinde (örneğin Tunus, İran, Türkiye) boşanmaları bir miktar artırmıştır. Örneğin, Türkiye'de boşanma oranı 1.000'de 1,7 olmasına rağmen geleneksel aile yapıları değiştikçe bu oran yükselmektedir.
- Latin Amerika: Latin Amerika ülkeleri Katolik etkisi nedeniyle tarihsel olarak düşük boşanma oranlarına sahipti (birçoğu 20. yüzyılın sonlarına kadar boşanmayı yasaklamıştı). Son birkaç on yılda, Latin Amerika'da boşanma yasal ve daha yaygın hale gelmiştirLatin ülkelerinin çoğunda kaba boşanma oranları 1.000'de 1-2 civarındadır (örneğin Brezilya ~1,4; Kolombiya ~0,7; Kosta Rika 2,6). Küba Küba devriminden bu yana uygulanan laik, sosyal liberal politikalara atfedilen dünyanın en yüksek boşanma oranlarından birine (1.000'de 2,5'in üzerinde ve evliliklerin >50%'si boşanmaktadır) sahip olmasıyla dikkat çekmektedir. Dominik Cumhuriyeti ve Porto Riko da her 1.000 kişide 2,4-2,6 gibi nispeten yüksek oranlara sahiptir. Öte yandan, kültürel olarak muhafazakâr olan Şili ve Peru düşük kalmaktadır (Şili'de bu oran ancak 2010'larda boşanma yasallaştıktan sonra 1.000'de 1,0'in üzerine çıkmıştır). Genel olarak, Latin Amerika kentleştikçe ve kadın hakları geliştikçe boşanmalar giderek artmakta, ancak aile merkezli kültür boşanmaları Batı'daki seviyelerin altında tutmaktadır. Daha da önemlisi, gayri resmi ayrılıklar ve rızaya dayalı birliktelikler Latin Amerika'da yaygındır ve bu durum boşanma istatistiklerine yansımayabilir - birçok çift yasal olarak boşanmadan ayrılmakta ya da başlangıçta resmi olarak hiç evlenmemektedir, bu da resmi rakamları etkilemektedir.
- Afrika: Afrika en az veriye sahip bölgedir, ancak geleneksel normlar evlilik istikrarını desteklemektedir. Birçok Afrika ülkesinde ikili evlilik sistemleri (medeni ve örfi) vardır; örfi hukuk kapsamındaki boşanmalar resmi olarak sayılmayabilir. Verilerin mevcut olduğu yerlerde (Güney Afrika, Mısır, Mauritius, Kenya), ham oranlar kabaca 0.5 ila 2.0. Genel olarak, Sahra altı Afrika düşük boşanma oranları kaydetmektedir. Örneğin, Nijerya ve Etiyopya'nın bildirilen oranları son derece düşüktür. Bir istisna ise Botsvana1990'larda Afrika için alışılmadık derecede yüksek bir boşanma oranına sahipti (muhtemelen anaerkil sosyal yapı nedeniyle evliliklerin 10%'den fazlası boşanmayla sonuçlanıyordu), ancak veriler sınırlıdır. Afrika toplumlarında başlık parası (çeyiz) ve toplum arabuluculuğu gibi faktörler boşanmayı caydırmaktadır. Ancak, çok eşlilik ve evlilik dışı birlikte yaşama, "boşanma" olarak kaydedilmeyen ilişki çözülmelerine yol açabilir. Afrika'da kadın okuryazarlığının ve istihdamının yüksek olduğu ülkelerde (örneğin Güney Afrika, Mauritius) boşanma oranlarının kadınların daha az özerkliğe sahip olduğu ülkelere kıyasla biraz daha yüksek olması dikkat çekicidir. Yine de Güney Afrika'da bile boşanma oranları Batı ülkelerine kıyasla mütevazıdır. Ekonomik stres iki yönlü olabilir: bazen aileleri parçalayabilir, ancak aynı zamanda evliliği insanların ayrılmaya isteksiz olduğu gerekli bir ekonomik ortaklık haline getirebilir.
Bir ekonomi̇k siniflandirma bakış açısı, yüksek geli̇rli̇ ekonomi̇ler ortalama olarak daha yüksek boşanma sıklığı bildirmektedir. düşük geli̇rli̇ ekonomi̇ler. Gelişmiş ülkelerde resmi boşanma oranlarının daha yüksek olmasının yanı sıra boşanmış bireyleri desteklemek için daha liberal yasalar ve sosyal güvenlik ağları bulunmaktadır. Buna karşın, düşük gelirli ülkelerde evlilik genellikle aile onuru, kadınların mali güvenliği ve sosyal statü ile iç içe geçmekte, bu da boşanmayı baskılamaktadır. Örneğin, boşanma oranlarının en düşük olduğu ilk 10 ülkenin tümü BM Toplumsal Cinsiyet Eşitsizliği Endeksi'nde (kadınlar için daha geleneksel, kısıtlayıcı rollere işaret eden) düşük puanlar almıştır. Bu da şunu göstermektedir çok düşük boşanma oranları, evlilikte mutluluktan ziyade kadınların sınırlı güçlenmesinin veya yasal engellerin bir işareti olabilir. Gerçekten de bir karşılaştırma yapıldığında, en düşük boşanma oranlarına sahip birçok ülkenin (örneğin Özbekistan, Moğolistan, Pakistan) toplumsal cinsiyet eşitliğinde alt sıralarda yer aldığı, en yüksek boşanma oranlarına sahip ülkeler arasında ise bazılarının nispeten toplumsal cinsiyet eşitliğine sahip olduğu (örneğin İsveç, Belçika), bazılarının ise olmadığı (Rusya, Belarus) görülmektedir. Kısacası, daha fazla kişisel özgürlük ve toplumsal cinsiyet eşitliği boşanma oranlarını bir noktaya kadar artırma eğilimindedirAncak aşırı yüksek boşanma oranları, orta gelirli ülkelerdeki sosyal istikrarsızlık veya değişen normlardan da kaynaklanabilir. Yüksek boşanma oranına sahip toplumlar farklı ekonomik düzeyleri kapsamakla birlikte, ortak noktaları evliliklerin sona erdirilmesinin kültürel olarak kabul görmesidir. Buna karşılık, boşanmanın en düşük olduğu toplumlar genellikle boşanma konusunda katı yasal/dinsel kısıtlamalar veya sosyal cezalar uygulamaktadır.
Sosyal, Yasal ve Kültürel Bağlam
Boşanma bir boşlukta gerçekleşmez - bir toplumun normları, yasaları ve evliliğe yönelik tutumlarından derinden etkilenir. Burada sosyal, yasal ve kültürel faktörlerin boşanma oranlarındaki farklılıkları nasıl yönlendirdiğini inceliyoruz:
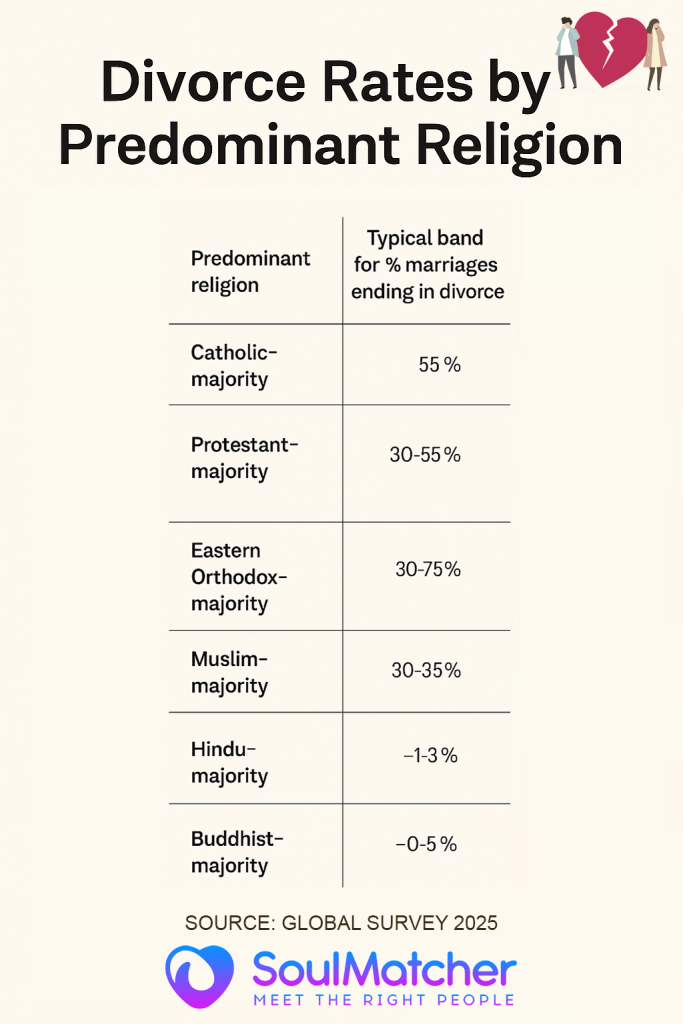
- Kültürel/Dini Normlar: Boşanma oranlarının belki de en güçlü belirleyicisi evliliğin kalıcılığına yönelik kültürel tutumdur. Evliliğin kutsal, çözülmez bir birliktelik olarak görüldüğü (genellikle din tarafından desteklenen) toplumlarda boşanma nadirdir. Örneğin Hindistan ve Müslümanların çoğunlukta olduğu birçok ülkede, boşanmaya atfedilen önemli bir damga vardır. Aileler, utançtan kaçınmak için mutsuz veya istismarcı durumlarda bile çiftlere birlikte kalmaları için baskı yapabilir. Hindistan'da evlilik kavramı genellikle "ömür boyu "dur ve boşanma o kadar ağır bir sosyal damga taşıyabilir ki evliliklerin yalnızca ~1%'si sona erer. Benzer şekilde, tarihsel olarak ağırlıklı olarak Katolik olan ülkelerde (örn. Filipinler, İrlanda, Polonya), boşanmaya karşı dini doktrin, yasal değişiklikler gerçekleşene kadar oranları son derece düşük tutmuştur. Buna karşın, bireysel mutluluğu ve kişisel tatmini vurgulayan kültürlerde boşanma oranları daha yüksek olma eğilimindedir. Bugün Avrupa ve Kuzey Amerika'nın büyük bölümünde boşanma, üzücü olmakla birlikte, sosyal olarak kabul görmekte ve oldukça yaygındır. Bu kabul 1960'lardan bu yana sekülerleşme nedeniyle önemli ölçüde artmıştır. Örneğin, Avrupa'da yükselen laiklik Batı Avrupa daha fazla boşanmaya karşılık gelmektedir (örn. İspanya'nın Katolik bir diktatörlükten laik bir demokrasiye geçiş 20. yüzyılın sonlarında boşanmanın evliliklerin 85%'sine yükselmesini sağlamıştır). Konfüçyüs etkisindeki Doğu Asya ülkeleri (Çin, Kore, Japonya) geleneksel olarak aile bütünlüğüne değer vermiş ve boşanma oranları düşük olmuştur, ancak bu toplumlar modernleştikçe ve daha bireyci hale geldikçe boşanma tabu olmaktan çıkmıştır - Güney Kore'nin 2000'li yılların başındaki yükselişi ve Çin'in istikrarlı yükselişi bunun kanıtıdır. Ülkeler içinde bile boşanmanın kentli, seküler nüfuslarda dindar veya kırsal topluluklara kıyasla daha yaygın olması dikkat çekicidir. Örneğin, Güney Kore'de Birleşik DevletlerEvanjelik Hristiyan topluluklar, boşanmanın dini olarak caydırılması nedeniyle genellikle ulusal ortalamadan biraz daha düşük boşanma oranlarına sahipken, daha liberal topluluklar daha yüksek oranlara sahiptir.
- Yasal Erişim ve Reformlar: Boşanmanın kolay veya zor olması kritik bir faktördür. Boşanmanın olduğu yerde yasadışı veya ağır şekilde kısıtlanmışoranları doğal olarak son derece düşüktür. Gördük ki Filipinler ve VatikanBoşanmaya izin verilmeyen ülkelerde resmi oranlar sıfırdır. Uzun bir ayrılık süresi, belirli gerekçeler (kusurlu boşanma) veya karşılıklı rıza gerektiren ülkelerde boşanma oranı genellikle hızlı, hatasız boşanmanın olduğu ülkelere göre daha düşüktür. Örneğin, Malta 2011'de boşanmayı yasallaştırdığında başlangıçta dört yıllık bir ayrılık süresi istemiş, bu da başlangıçta oranları düşük tutmuştur. İrlanda hala zorunlu bir ayrılma süresine sahiptir (yakın zamanda dört yıldan iki yıla indirilmiştir), bu da düşük oranını kısmen açıklamaktadır (~15%). Buna karşılık, aşağıdaki ülkelere hatasız, hızlı boşanma süreçleri daha yüksek oranlara sahip olma eğilimindedir. ABD (1970'ler) ve Avustralya (1975) gibi yerlerde sebepsiz boşanma yasalarının yürürlüğe girmesi, çiftlerin artık hatalı olduklarını kanıtlamalarına gerek kalmaması nedeniyle boşanma başvurularında ani artışlara yol açmıştır. Günümüzde çoğu Batı ülkesi sebepsiz olarak karşılıklı rıza ile boşanmaya izin vermekte, bu da daha yüksek boşanma seviyelerini normalleştirmektedir. Hatta bazı ülkeler prosedürleri basitleştirmektedir (örn. Norveç ve İsveç kısa bir bekleme süresinden sonra çevrimiçi başvurulara izin vermektedir). Karşılaştırmalı bir analize göre, en basit ve en az külfetli boşanma prosedürlerine sahip ülkeler şunlardır Norveç, İsveç, İspanya, Meksika, Slovenya, ArjantinBunların hepsi de bekleneceği üzere orta ila yüksek boşanma oranlarına sahiptir. Tersine, çok karmaşık boşanma yasalarına sahip ülkeler - örneğin, Pakistan (kadınların mahkemeye gitmesi ve gerekçelerini kanıtlaması gerekirken, erkekler tek taraflı olarak reddedebilir) veya Mısır (hatasız boşanma için kadınların mali haklarından feragat etmeleri gereken) - daha az boşanma veya daha fazla erkek egemen boşanma başvurusu görülüyor. Yasal reformlar istatistikleri hemen etkileyebilir: Şili 2004'e kadar yasal boşanmalar neredeyse sıfırdı; yasallaşmanın ardından bastırılmış talep binlerce boşanmanın kayıt altına alınmasına neden olarak oranı artırdı. Brezilya 2010'da zorunlu ayrılma süresini kaldırmasının ardından bir artış yaşamıştır. İçinde ÇinYakın zamanda yürürlüğe giren bekleme süresi yasası, sürece sürtünme katarak boşanma sayılarını geçici olarak baskılamış gibi görünmektedir. Dolayısıyla, hukuk sisteminin ne kadar boşanma dostu ya da boşanma karşıtı olduğu büyük bir rol oynamaktadır.
- Kadın Hakları ve Ekonomik Bağımsızlık: Tutarlı bir bulgu da şudur kadinlar sosyoekonomi̇k güç kazandikça boşanma oranlari artiyor. Kadınlar eğitim, kariyer ve yasal haklara sahip olduklarında, mutsuz veya baskıcı evliliklere tahammül etme olasılıkları azalır. Tarihsel olarak, kadınların mülk sahibi olamadığı veya kendi geçimlerini sağlayamadığı toplumlarda boşanma nadirdi çünkü boşanma kadınları genellikle yoksulluğa veya sosyal sürgüne sürüklüyordu. Bu engeller ortadan kalktıkça boşanmalar da artmıştır. Örneğin, 1970'lerde Batı dünyasında boşanmaların artması, kadın özgürlüğü hareketi ve daha fazla kadının çalışmasıyla ilişkilidir. ABD. çok sayıda kadının işgücüne katıldığı ve evliliğe ilişkin normların değiştiği bir dönemde boşanmaların zirve yaptığını görmüştür). Doğu Asya'da 1990-2000'lerde artan boşanmalar, kadınların eğitim ve işgücüne katılımının artmasına paralel olarak Güney Kore, Çin, Tayvanvb. Orta Doğu'da veriler, kadın okuryazarlığının daha yüksek olduğu ülkeleri göstermektedir (örn. İran, Türkiye) kadınların daha az güçlendiği ülkelere (örneğin boşanmanın çok düşük olduğu Yemen) kıyasla daha yüksek boşanma oranlarına sahiptir. Açık bir toplumsal cinsiyet boyutu vardır: birçok yerde, kadınlar boşanmayı erkeklerden daha sık başlatıyor Örneğin, ABD'deki boşanmaların yaklaşık 70%'si kadınlar tarafından gerçekleştirilmektedir; bu durum diğer gelişmiş ülkelerde de görülen bir modeldir ve kadınların daha bağımsız hale geldikçe tatmin edici olmayan evlilikleri sona erdirmeye daha istekli olduklarını göstermektedir. Bu arada, Arap dünyasının bazı bölgeleri gibi boşanmanın büyük ölçüde erkeklerin inisiyatifinde olduğu yerlerde (yasalar veya normlar nedeniyle) boşanma farklı sosyal anlamlar taşıyabilir (bazen yüksek oranlar erkeklerin sık sık boşanıp yeniden evlendiğini gösterebilir). Genel olarak, iyileştirilmiş yasal haklar (mal rejimi yasaları, nafaka uygulaması gibi) ve sosyal destek (boşanmış kadınlar için daha az damgalanma gibi) pratik engelleri ortadan kaldırarak boşanma oranlarının yükselmesine katkıda bulunmaktadır.
- Ekonomik Stres ve Kentleşme: Mantığa aykırı bir şekilde, hem refah hem de yoksulluk boşanmayı farklı şekillerde etkileyebilmektedir. Ekonomik istikrar boşanmayı kolaylaştırabilir çünkü eşler hayatta kalmak için birlikte kalmak zorunda değildir. Aynı zamanda, ekonomik stres (işsizlik, enflasyon) evlilikleri zorlayabilir ve yıkıma yol açabilir. Örneğin Sovyetler Birliği'nin çöküşünün ardından yaşanan ekonomik çalkantılar muhtemelen evliliklerdeki istikrarsızlığa katkıda bulunmuştur. 1990'lardaki ekonomik krizler sırasında Rusya'da boşanma oranı artmıştır. Yunanistan'da son mali kriz sırasında boşanmaların arttığı bildirildi. Öte yandan, durgunluklar da geçici olarak daha düşük Çiftlerin masraflı yasal işlemleri ertelemeleri veya haneleri ayırmaya güçlerinin yetmemesi durumunda boşanma oranları düşmektedir. Bu durum 2008 küresel durgunluğunda bazı ülkelerde boşanma oranlarında hafif düşüşler görülmüştür. Kentleşme boşanmayı artırma eğilimindedir: şehirlerde geleneksel aile denetimi daha zayıftır ve insanlar daha çeşitli yaşam tarzlarına (ve ayartmalara) maruz kalmaktadır. Şehirler ayrıca boşanmış bireyler için daha fazla anonimlik ve destek ağı sunmaktadır. Örneğin, Çin'de en yüksek boşanma oranları Şangay ve Pekin gibi büyük şehirlerde görülürken, kırsal kesimdeki köylerde çok daha az boşanma yaşanmaktadır.
- Değişen Toplumsal Beklentiler: Modern evlilikler, geleneksel faydacı evliliklere kıyasla genellikle farklı beklentilere (duygusal tatmin, paylaşılan roller) sahiptir. Bazı akademisyenler, beklentiler yükseldikçe tatmin edici olmayan bir evliliğe tahammülün azaldığını ve bunun da daha fazla boşanmaya yol açtığını savunmaktadır. Bu durum ABD bağlamında da dile getirilmiştir: sevgi ve kendini gerçekleştirmeye dayalı evliliklere geçiş, bu ihtiyaçların karşılanmaması halinde daha fazla boşanmaya yol açabilir. Dünya genelinde genç kuşaklar boşanma konusunda ebeveynlerine kıyasla daha liberal tutumlara sahiptir ve bu da boşanmayı giderek normalleştirmektedir. A BM küresel genel bakış 2000'li yıllara gelindiğinde, 1970'lere kıyasla 30'lu yaşların sonunda iki kat daha fazla insanın boşanmış/ayrılmış olduğunu belirtmiştir - bu durum sadece yasal değişimi değil, aynı zamanda mutsuz bir evlilikte kalmak zorunda olunmadığına dair toplumsal kabulü de yansıtmaktadır. Ayrıca, Asya gibi bölgelerde görücü usulü evliliklerin azalması ve aşk evliliklerinin artması paradoksal olarak boşanmaları artırabilir: bireyler eşlerini aşka dayalı olarak seçtiklerinde, aşkın azalması durumunda ayrılmayı da seçebilirler, oysa görücü usulü evlilikler devam etmek için daha güçlü aile baskılarıyla birlikte gelir.
- Birlikte Yaşamanın Etkisi: Birçok Batı ülkesinde, artan birlikte yaşama (evli olmadan birlikte yaşama) boşanma istatistiklerini etkilemiştir. Birlikte yaşama bir "deneme evliliği" veya evliliğe bir alternatif olarak hizmet edebilir. Bazı ülkelerde (örn. İsveç, Fransa), birçok çift evlenmeden birlikte yaşamakta ve hatta çocuk sahibi olmaktadır. Bu birlikteliklerden bazıları boşanma istatistiklerine hiç girmeden sona ermektedir. Birlikte yaşama, evlilik oranlarının düşmesine katkıda bulunmuştur ve bu da boşanma oranlarını düşürebilir (çünkü başlangıçta daha az insan evlenmektedir). Bununla birlikte, birlikte yaşama iki yönlü olabilir: evlilikten önce daha zayıf ilişkileri ayıklayabilir (daha istikrarlı evliliklere yol açabilir) veya evlenip boşanacak olanların bunun yerine birlikte yaşayıp ayrıldıkları bir değişimi yansıtabilir. Genel olarak, Avrupa ve Amerika'da birlikte yaşamanın artması, boşanma oranlarının son zamanlarda durağanlaşmasının veya düşmesinin bir nedenidir - bazı ayrılıklar "boşanma" olarak sayılmamaktadır.
- Politika ve Destek Sistemleri: Bazı hükümetler boşanmayı etkileyen politikaları aktif olarak uygulamaktadır. Örneğin, zorunlu danışmanlık veya arabuluculuk (İsveç ve bazı ABD eyaletlerinde olduğu gibi) düşünmeden boşanmaları azaltabilir. Tersine, tek ebeveynleri destekleyen refah politikaları boşanmayı daha uygulanabilir hale getirebilir. Çocuk velayeti ve destek yasaları da rol oynamaktadır: eğer yasalar çocukların ve daha az kazanan eşin geçiminin sağlanacağını garanti ediyorsa, eşler boşanma konusunda kendilerini daha özgür hissedebilirler. Böyle bir desteğin olmadığı ülkelerde ebeveynler (özellikle de anneler) çocukların iyiliği için evliliklerini sürdürebilir. Veriler, devletin güvenlik ağları sağladığı yerlerde boşanmaların daha yüksek olduğunu göstermektedir (örneğin Kuzey Avrupa'nın cömert refahı, bireyler evlilikten ayrılarak yoksulluk riskine girmedikleri için yüksek boşanmalarla aynı zamana denk gelmektedir). Bazı ülkeler (özellikle Malezya, Endonezya) boşanma prosedürlerini daha katı hale getirerek ya da toplumsal uzlaşma programlarıyla aileleri güçlendirmeye çalışmış, ancak karışık sonuçlar elde etmiştir. COVID-19 salgını, politika ve koşulların etkileşiminin yakın tarihli bir örneğidir: sokağa çıkma yasakları başlangıçta düşmek 2020'de küresel olarak boşanmalarda düşüş yaşandı (mahkemeler kapandı ve çiftler ayrılıkları erteledi). Ancak bazı bölgelerde, bastırılmış talep serbest bırakıldığı için daha sonra boşanmalarda bir toparlanma meydana geldi (ör. Letonya'nın boşanma oranı 2020'deki düşüşün ardından 2021-22'de sıçrama yapmıştır).
Özetle, toplumsal bağlam çok önemlidir boşanma oranlarını anlamak için. Boşanmanın yüksek olduğu toplumlar genellikle seküler tutumlara, erişilebilir yasal süreçlere, daha fazla toplumsal cinsiyet eşitliğine ve bireysel seçime vurgu yapmaktadır. Boşanmanın düşük olduğu toplumlar ise genellikle güçlü dini veya aşiret kontrollerine, yasal engellere ve boşanmanın (özellikle kadınlar için) önemli sosyal veya ekonomik cezalarına sahiptir. Boşanmanın az olduğu ülkelerde insanlar evliliklerinde hiçbir zaman ayrılık veya çatışma yaşamamaktadır, bunun yerine evli kalma baskısı (veya boşanma mekanizmalarının eksikliği) evliliklerin kağıt üzerinde bozulmadan kalmasını sağlamaktadır. Bu arada, boşanmaların yüksek olduğu ülkelerde, ilişkinin tatmin edici olmaması halinde evliliği sona erdirmeyi uygulanabilir bir yol haline getiren destek sistemleri ve toplumsal kabul sıklıkla mevcuttur. Bir araştırma özetinde belirtildiği gibi, "Genel olarak, bir ülkedeki kadınların eğitim seviyesi ne kadar yüksekse, o ülkedeki boşanma oranı da o kadar yüksektir." Sosyal bilimciler ayrıca boşanmaya yönelik tutumların hem boşanma oranını etkilediğini hem de boşanma oranından etkilendiğini belirtmektedir: boşanma bir toplumda daha yaygın hale geldikçe, normalleşmenin bir geri bildirim döngüsü yaratarak damgalanmayı daha da kaybeder.
Sonuç ve Temel Çıkarımlar
Dünyanın dört bir yanındaki boşanma oranları kültürel değerler, yasal çerçeveler, ekonomik koşullar ve sosyal değişimin karmaşık etkileşimini yansıtmaktadır. Birkaç anahtar bulgular Bu kapsamlı genel bakışta yer alan konular şunlardır
- Küresel Trend: Yirminci yüzyılın ikinci yarısında özellikle Batı ülkelerinde olmak üzere boşanma oranlarında küresel bir artış görülmüştür, ancak 21. yüzyılda bu eğilim ikiye ayrılmıştır. Birçok yüksek gelirli ülkede 2000 yılından bu yana boşanmalarda istikrar veya azalma görülürken, bazı orta gelirli ülkeler hala yükseliştedir. 2020'lerden itibaren dünyanın ortalama ham boşanma oranı kabaca 1.000'de 1-2Ancak bu ortalama büyük farklılıkları maskelemektedir.
- En Yüksek Oranlar: Boşanma yaygınlığının en yüksek olduğu ülkeler Doğu Avrupa (eski Sovyet), parçaları Batı Avrupave bazı Yeni Dünya ülkeler. Boşanma ile sonuçlanan evliliklerin payı ile ölçülmüştür, İspanya (~85%) gibi ülkeler tarafından takip edilmektedir. Rusya (~74%), **Belçika (~70%)*, ve Küba (~56%). Bunlar ya çok düşük evlilik oranlarına ya da çok müsamahakâr boşanma uygulamalarına (ya da her ikisine) sahip yerlerdir. Yıllık ham orana göre ölçüldüğünde, en üst sıralarda şunlar yer almaktadır Maldivler, Kazakistan/Belarus/Gürcistan (~3,5-3,8) ve son zamanlarda bir aykırı değer Kuzey Makedonya. Genel olarak, 1.000'de 3'ün üzerinde bir boşanma oranı günümüz bağlamında yüksek kabul edilmektedir. Yüksek boşanma oranına sahip ülkeler genellikle geleneksel aile bağlarını gevşeten hızlı sosyal liberalleşme veya ekonomik çalkantılardan geçmiştir.
- En Düşük Fiyatlar: Diğer uçta, Güney Asya ve Batı Afrika ülkeleri en düşük boşanma oranlarına sahiptir. Hindistan'ın ~1% Boşanma sıklığı, güçlü evlilikte kalıcılık normunun bir göstergesidir. Çok düşük oranlara sahip diğer ülkeler (1.000'de 0,5'in altında veya evliliklerin <10%'si) şunlardır Bhutan, Sri Lanka, Vietnam, Guatemala, Peru ve bazı Afrika ülkeleri. Bu yerlerin çoğunda boşanmalar sosyal olarak ve bazen de yasal olarak engellenmektedir. Buna ek olarak, bazı eyaletlerde boşanmaya yasal yasak (Filipinler, Vatikan), faiz oranlarını etkin bir şekilde sıfırda tuttu.
- Bölgesel Farklılıklar: Avrupa Doğu (Baltıklar ve Slav ülkelerinde çok yüksek boşanma) ve Batı/Kuzey (yüksek ancak bazı düşüşlerle birlikte biraz daha düşük) ve Güney (ılımlı, düşük bir tabandan yükseliyor) arasında bir bölünmeye sahiptir. Kuzey Amerika/Okyanusya orta-yüksek boşanma yaygınlığı (evliliklerin 40-50%'si) ile nispeten homojendir. Latin Amerika yasallaştırma sonrasında artmakla birlikte, genellikle orta ila düşük düzeyde boşanmadır. Asya Doğu Asya'da en yüksekten Güney Asya'da en düşüğe, Güneydoğu Asya'da ise orta dereceye kadar değişmektedir. Afrika daha yüksek olan birkaç ülke dışında büyük ölçüde düşüktür. Bu farklılıklar genellikle her bölgenin baskın dini ve kültürel geçmişinin yanı sıra gelişmişlik düzeyiyle de uyumludur.
- Tarihsel Değişim: Büyük ülkelerde boşanma 20. yüzyılın sonlarında çok daha yaygın hale gelmiştir, ancak "boşanma patlaması" yavaşlamıştır. Örneğin, ABD ve birçok Avrupa ülkesinde, daha az sayıda insanın düşünmeden evlenmesi ve evlilik kalitesiyle ilgili beklentilerin gelişmesiyle boşanma oranları zirve noktalarından düşüşe geçmiştir. Bazı uzmanlar, artık evlenenlerin bunu daha bilinçli bir şekilde yaptığı ve potansiyel olarak daha dayanıklı evliliklere yol açan bir dengelenme görüyor olabileceğimizi öne sürüyor (bazı verilerde Y kuşağı için boşanma oranlarının düşmesinde görüldüğü gibi). Aynı zamanda, dünyanın diğer bölgeleri (örneğin Asya'nın bazı bölgeleri, Orta Doğu) girmek modernleşmeyle birlikte boşanmaların arttığı bir döneme girmişlerdir.
- Sosyal Bağlam: Yüksek boşanma oranları doğası gereği "iyi" veya "kötü" değildir - daha fazla kişisel özgürlük ve cinsiyet eşitliğine işaret edebilir (insanlar kötü evliliklerden çıkabilir), ancak aynı zamanda sosyal stresleri veya destek ağlarının zayıflamasını da yansıtabilir. Düşük boşanma oranları istikrarlı ailelere ve güçlü bağlılığa işaret edebileceği gibi, savunulamaz evlilikler yaşayanlar için seçeneklerin azlığına da işaret edebilir. Örneğin, bir toplumda boşanma oranının çok düşük olması, çok sayıda gayri resmi ayrılığı veya alternatifsizlik nedeniyle kadınların istismara maruz kalmasını maskeleyebilir. Dolayısıyla boşanma istatistiklerini anlamak, rakamların ötesine bakmayı gerektirir. sosyal dokuÖrneğin, İsveç'te yüksek boşanma, yüksek yaşam memnuniyeti ve toplumsal cinsiyet eşitliği ile bir arada bulunurken Afganistan'da düşük boşanma, düşük kadın özerkliği ile bir arada bulunmaktadır.
- COVID-19'un etkisi: Kısa bir not - COVID-19 salgını başlangıçta 2020'de boşanmalarda bir düşüşe neden oldu (mahkemeler kapandığından ve çiftler kararlarını ertelediğinden). Bazı ülkelerde (örneğin Birleşik Krallık, ABD'nin bazı bölgeleri) 2021-2022 yıllarında bir toparlanma görülmüştür. Pandeminin net etkisi hala araştırılıyor, ancak muhtemelen Gecikmeli birçok boşanmayı önlemek yerine daha da artırmıştır. Ayrıca, bazıları için uzun vadede boşanmaları artırabilecek yeni stresler (kilitlenme çatışmaları) ortaya çıkarmıştır. Örneğin, Çin ve Avrupa ülkelerinden gelen anekdot niteliğindeki kanıtlar, karantinaların kaldırılmasının hemen ardından boşanma başvurularında bir artış olduğunu göstermektedir. Genel olarak pandemi, dış olayların aile dinamiklerini geçici olarak nasıl değiştirebileceğini, ancak temel eğilimlerin daha sonra nasıl devam ettiğini vurgulamıştır.
Sonuç olarak, küresel boşanma oranlari toplumsal deği̇şi̇mi̇n aynasi. Hızlı toplumsal geçişlerin (ekonomik kalkınma, toplumsal cinsiyet rollerindeki değişimler, sekülerleşme) yaşandığı ülkelerde, yerleşik normlar yıkıldıkça ve bireyler kişisel tatminlerine öncelik verdikçe boşanmalarda artış görülmektedir. Buna karşılık, geleneksel yapılara sıkı sıkıya bağlı toplumlarda - ister seçimle ister zorlamayla olsun - boşanma nadirdir. Dünya gelişmeye devam ettikçe ve kültürel değerler evrildikçe, daha fazla ülkenin bir noktaya kadar daha yüksek boşanma oranları yaşaması muhtemeldir. Nitekim Birleşmiş Milletler, dünya genelinde boşanmış/ayrı yaşayan yetişkinlerin oranının 1970'lerden 2000'lere iki katına çıkarak arttığını belirtmektedir. Yine de şunları da görebiliriz yakınsamaAşırı yüksek boşanma oranına sahip ülkeler (evlilik daha az yaygınlaştıkça veya ilişkiler daha iyi eşleşmeyle güçlendikçe) istikrar kazanabilir ve aşırı düşük boşanma oranına sahip ülkeler tutumlar liberalleştikçe kademeli olarak artabilir.
Politika perspektifinden bakıldığında veriler, evlilik istikrarı ile bireysel refahın dengelenmesi ihtiyacına işaret etmektedir. Yüksek boşanma oranına sahip toplumlar, tek ebeveynli aileleri destekleme ve (genellikle ekonomik ve duygusal etkilerle karşılaşan) boşanma çocuklarının ihtiyaçlarını karşılama gibi zorluklarla karşı karşıyadır. Öte yandan, boşanma oranlarının düşük olduğu toplumlar, toplumsal veya yasal baskılar nedeniyle evliliklerinde sıkışıp kalan bireylerin haklarını ve refahını göz önünde bulundurmalıdır. Nihayetinde amaç, boşanma oranlarını keyfi olarak yükseltmek ya da düşürmek değil, aşağıdakileri sağlamaktır evliliğe özgür seçimle girilir ve çıkılır ve ailelerin ve bireylerin yapıdan bağımsız olarak ihtiyaç duydukları desteğe sahip olmaları. Boşanmanın küresel tablosu, bazı kültürlerde neredeyse evrensel olan ömür boyu evlilikten, diğerlerinde evliliğin yazı tura atma teklifi haline gelmesine kadar çarpıcı bir çeşitlilik göstermektedir - en kişisel kurumlardan biri olan evliliğin, etrafındaki daha geniş toplum tarafından nasıl derinden şekillendirildiğinin altını çizmektedir.
Kaynaklar: Birleşmiş Milletler'den derlenen veriler Demografik YıllıkDünya Bankası ve OECD aile veri tabanları, ulusal istatistik kurumları (örneğin AB ülkeleri için Eurostat, Amerika için U.S. CDC/NCHS) ve ülkeler arası boşanma belirleyicileri üzerine akademik araştırmalar. Ülkelere göre evlilik ve boşanma oranlarına ilişkin rakamlar, yukarıda belirtildiği gibi mevcut en son resmi kayıtlardan alınmıştır ve Our World in Data tarihsel eğilim görselleştirmeleri sağlamaktadır. Bu kaynaklar toplu olarak küresel boşanma örüntülerinin güvenilir ve güncel bir temsilini sağlamaktadır.