Einführung und Schlüsselmetriken
Scheidungen sind in den letzten Jahrzehnten weltweit immer häufiger geworden, wobei die Trends je nach Land und Region sehr unterschiedlich sind. Weltweit hat sich die rohe Scheidungsrate (jährliche Scheidungen pro 1.000 Personen) von den 1970er bis zu den 2000er Jahren etwa verdoppelt. In der Europäischen Union zum Beispiel stieg die Scheidungsrate von etwa 0,8 pro 1.000 Einwohner im Jahr 1964 zu 2,0 pro 1.000 im Jahr 2023, während die Heiratsraten im gleichen Zeitraum um 50% zurückgingen. Die Scheidungsmuster sind jedoch alles andere als einheitlich - sie spiegeln die sozialen Normen, den rechtlichen Rahmen und die demografischen Trends der einzelnen Länder wider. Zwei wichtige Methoden zur Messung von Scheidungen sind:
- Rohe Scheidungsrate: die Anzahl der Scheidungen pro 1.000 Personen in einem bestimmten Jahr. Sie gibt die jährliche Häufigkeit von Scheidungen in der Bevölkerung an.
- Scheidungsquote (Prozentsatz der Ehescheidungen): die Zahl der Scheidungen im Verhältnis zur Zahl der Eheschließungen, oft als Prozentsatz ausgedrückt (z. B. Scheidungen pro 100 Eheschließungen). Dies gibt einen ungefähren Lebenszeitrisiko dass eine Ehe letztendlich in einer Scheidung enden wird. Ein Verhältnis von 50% deutet beispielsweise darauf hin, dass etwa die Hälfte der Ehen geschieden wird.
Es ist wichtig, diese Messgrößen im Kontext zu interpretieren. Die rohen Raten können durch den Anteil der unverheirateten Bevölkerung oder durch die Altersstruktur beeinflusst werden. Die Scheidungsrate ist eine grobe Schätzung des lebenslangen Scheidungsrisikos; sie geht davon aus, dass die aktuellen Heirats- und Scheidungsmuster konstant bleiben, obwohl in Wirklichkeit die tatsächlichen lebenslangen Scheidungsraten berechnet werden, indem man die Heiratskohorten über die Zeit verfolgt. Dennoch vermitteln diese Indikatoren zusammen ein nützliches Bild der Scheidungsprävalenz.
Scheidungsstatistik nach Ländern (neueste Daten)
In den nachstehenden Tabellen sind die Scheidungsraten für die Länder aufgeführt, für die verlässliche Daten vorliegen, einschließlich des letzten Jahres der Daten, der rohen Scheidungsrate, der rohen Heiratsrate und des geschätzten Prozentsatzes der Ehen, die in einer Scheidung enden (Verhältnis von Scheidung zu Heirat). Dies bietet eine Aufschlüsselung der Scheidungsprävalenz nach Ländern.
Europa
In Europa gibt es einige der höchsten Scheidungsraten der Welt. In vielen europäischen und ehemals sowjetischen Ländern kam es Ende des 20. Jahrhunderts zu einem sprunghaften Anstieg der Scheidungen, und heute werden 40-90% der Ehen geschieden. Im Gegensatz dazu weisen einige europäische Länder, in denen die Scheidung erst vor kurzem legalisiert oder normalisiert wurde, wesentlich niedrigere Raten auf.
| Land | Daten Jahr | Scheidungen pro 1.000 Personen | Eheschließungen pro 1.000 Personen | % der Ehen, die in Scheidung enden |
|---|---|---|---|---|
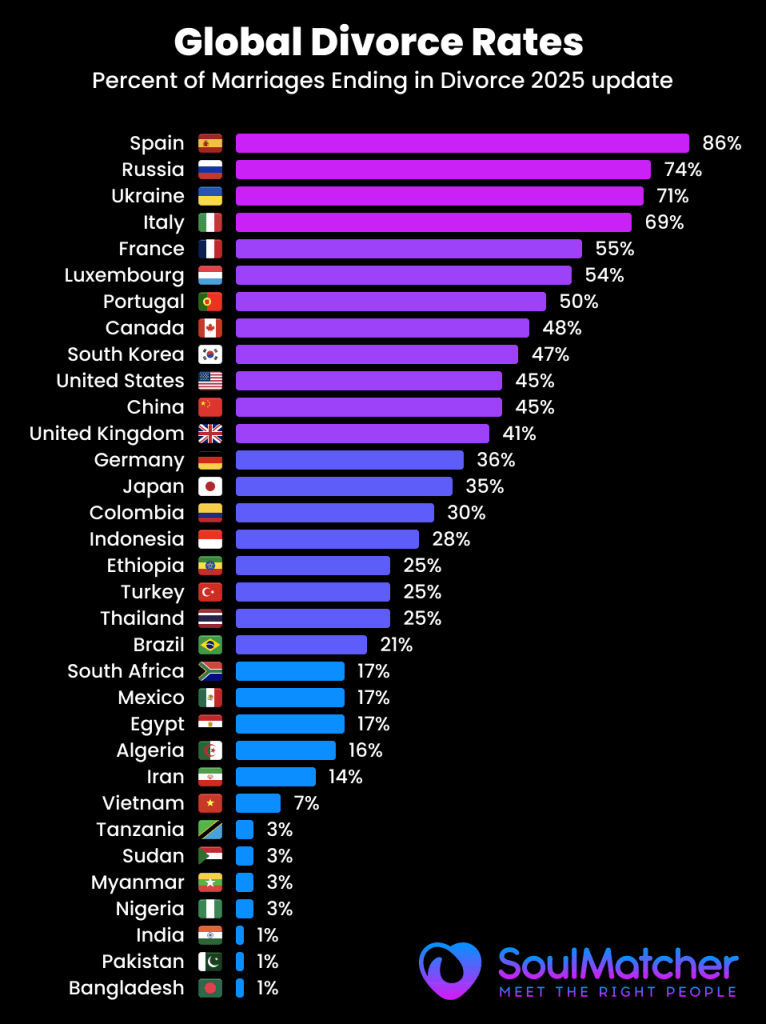
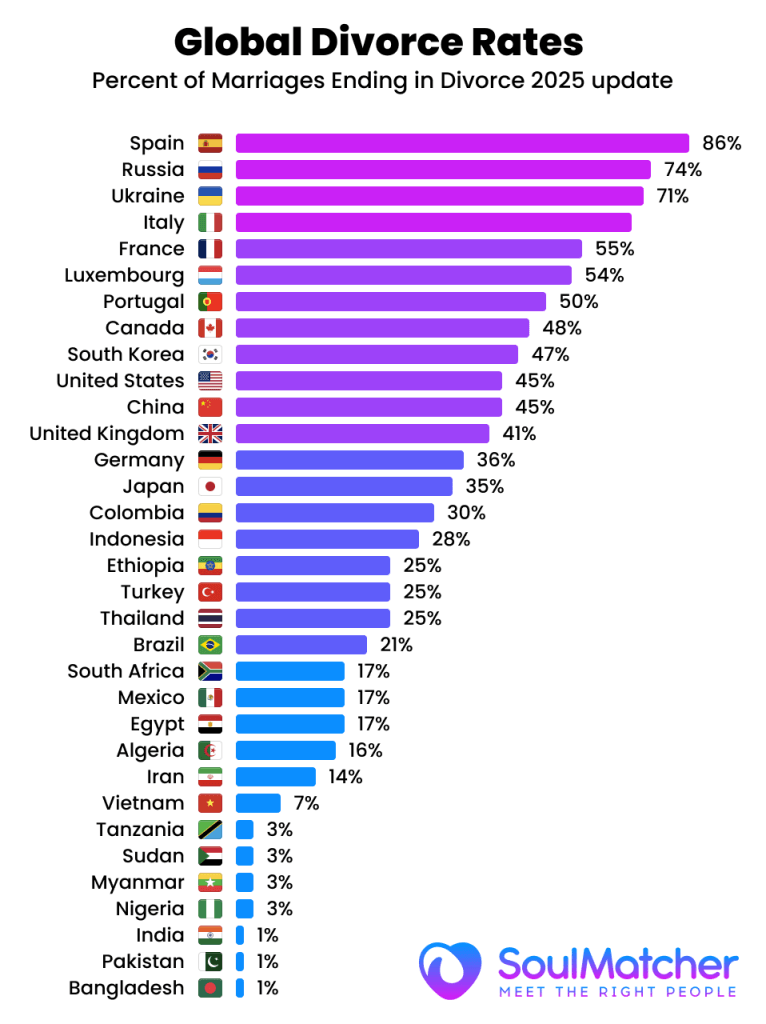
| Spanien | 2020 | 1.6 | 1.9 | 84.2% (welt-hoch) |
| Russland | 2020 | 3.9 | 5.3 | 73.6% |
| Ukraine | 2020 | 2.9 | 4.1 | 70.9% |
| Frankreich | 2016 | 1.9 | 3.7 | 51.3% |
| Portugal | 2023 | 2.0 | 2.8 | 47% |
| Schweden | 2018 | 2.5 | 5.0 | 50.0% |
| Italien | 2018 | 1.5 | 3.2 | 46.9% |
| Deutschland | 2017 | 1.9 | 4.9 | 38.8% |
| Vereinigtes Königreich (E&W) | 2015 | 1.8 | 4.4 | 40.9% |
| Polen | 2018 | 1.7 | 5.1 | 33.3% |
| Rumänien | 2018 | 1.6 | 7.4 | 21.6% |
| Irland | 2017 | 0.7 | 4.6 | 15.2% |
| Malta | 2018 | 0.7 | 5.8 | 12.1% |
Europa: Spanien sticht mit einem geschätzten 90% der Ehen, die mit einer Scheidung endenzu den höchsten in der Welt. Im Gegensatz dazu sind traditionell katholische Länder, die erst seit kurzem die Scheidung zulassen (z. B. Malta (2011), Irland (1996)) haben immer noch sehr niedrige Scheidungsraten (unter 0,8 pro 1.000) und nur etwa 12-15% der Ehen enden mit einer Scheidung. Die großen westeuropäischen Länder liegen dazwischen: z. B. etwa 50% der Eheschließungen in Frankreich in einer Scheidung enden, ~41% im UKund ~39% in Deutschland. Die nordischen Länder haben etwa 45-50% der Ehen, die mit einer Scheidung enden (z. B. Schweden ~50%). Viele osteuropäische und postsowjetische Staaten haben eine hohe Scheidungsprävalenz: z. B., Russland (74%) und Ukraine (71%). In diesen Ländern kam es während und nach der Sowjetzeit zu einem Anstieg der Scheidungen. In einigen osteuropäischen Ländern sind die Raten niedriger (Rumänien ~22%, traditionell aufgrund konservativerer Normen). Insgesamt liegen die rohen Scheidungsraten in Europa meist zwischen etwa 1 bis 3 pro 1.000Der Median liegt bei etwa 1,5 bis 2,5 pro 1.000, aber die Prozentsätze der Scheidungen im Verhältnis zu den Eheschließungen variieren aufgrund der unterschiedlichen Heiratsraten stark. Ein Teil des langfristigen Anstiegs der Scheidungen in Europa ist auf gesetzliche Änderungen zurückzuführen - die Scheidung wurde in Italien (1970), Spanien (1981), Irland (1996) und Malta (2011) legalisiert, was zu einem Anstieg der Scheidungszahlen in diesen Ländern im Laufe der Zeit beitrug.
Nord-Amerika
Auch in Nordamerika sind die Scheidungsraten relativ hoch, wenngleich in einigen Gebieten in letzter Zeit ein rückläufiger Trend zu verzeichnen ist.
| Land | Daten Jahr | Scheidungen pro 1.000 Personen | Eheschließungen pro 1.000 | % der Ehen, die in Scheidung enden |
|---|---|---|---|---|
| Vereinigte Staaten | 2020 | 2.3 | 5.1 | 45.1% |
| Kanada | 2008 | 2.1 | 4.4 | 47.7% |
| Kuba | 2010 | 2.9 | 5.2 | 55.8% |
| Mexiko | 2020 | ~1.0 | ~5,5 (geschätzt) | ~20% (geschätzt) |
| Chile | 2009 | 0.7 | 3.3 | 21.2% |
| Guatemala | 2019 | (sehr niedrig) | (hoch) | ~5% (geschätzt) |
Nord-Amerika: Die Vereinigte Staaten hatte lange Zeit eine der höchsten rohen Scheidungsraten unter den großen Ländern (mit einem Höchststand von fast 5,0 in den frühen 1980er Jahren). Im Jahr 2000 lag die Rate in den USA bei 4,0 pro 1.000, ist aber seitdem auf 2,3 pro 1.000 ab 2020. Heute etwa 42-45% der Ehen in den USA enden schätzungsweise mit einer Scheidung. Nachbarschaft Kanada ist ähnlich mit etwa 48% der Ehen enden mit einer Scheidung (Stand ~2008). In der Karibik und Zentralamerika, Kuba hat eine außergewöhnlich hohe Scheidungsrate - etwa 56% der Ehen enden mit einer Scheidung, was die historisch bedingte Leichtigkeit der Scheidung widerspiegelt. Im Gegensatz dazu, MexikoDie rohe Scheidungsrate (~1,0) ist recht niedrig; aufgrund der starken Familientraditionen sind nur schätzungsweise 20-25% der mexikanischen Ehen werden geschieden (Näherungswert auf der Grundlage aktueller Daten). Mehrere lateinamerikanische Länder hatten in der Vergangenheit sehr niedrige Scheidungsraten (in einigen Fällen, weil die Scheidung bis vor kurzem verboten oder unüblich war). Zum Beispiel, Chile hat die Scheidung erst 2004 legalisiert und hatte 2009 immer noch eine niedrige Rate (0,7 pro 1.000, ~21% der Ehen). Jahrhundert in Lateinamerika zugenommen, aber kulturelle Normen halten die Raten moderat - viele Länder in Zentralamerika (z. B. Guatemala, Honduras) melden deutlich weniger als eine Scheidung pro 1.000 Personen, was bedeutet, dass weniger als 10% der Ehen in einer legalen Scheidung enden (obwohl informelle Trennungen höher sein können).
Asien
Asien weist die umfangreichste Palette der Scheidungsraten, was auf die unterschiedlichen Kulturen und Gesetze zurückzuführen ist. In einigen ostasiatischen und eurasischen Ländern ist die Scheidungsrate mit am höchsten, während sie in Südasien am niedrigsten ist.
| Land | Daten Jahr | Scheidungen pro 1.000 Personen | Eheschließungen pro 1.000 | % der Ehen, die in Scheidung enden |
|---|---|---|---|---|
| China | 2018 | 3.2 | 7.2 | 44.4% |
| Südkorea | 2019 | 2.2 | 4.7 | 46.8% |
| Japan | 2019 | 1.7 | 4.8 | 35.4% |
| Israel | 2009 | 1.8 | 6.5 | 27.7% |
| Saudi-Arabien | 2020 | 2.1 | 5.6 | 37.5% |
| Kasachstan | 2021 | 2.5 | 7.3 | 34.3% |
| Türkei | 2018 | 1.7 | 6.8 | 25.0% |
| Vietnam | 2015 | 0.4 | 5.7 | 7.0% |
| Indien | ~2018 | 0.1 | ~10 | ~1% (niedrigste) |
| Philippinen | K.A. | Scheidung rechtswidrig | - | 0% (gesetzliches Verbot) |
Asien: Mehrere ostasiatisch Die Länder haben einen raschen sozialen Wandel durchgemacht und weisen heute hohe Scheidungsraten auf. SüdkoreaDie Scheidungsrate stieg in den 1990er- bis 2000er-Jahren dramatisch an, und bis 2019 werden etwa 47% der Ehen wurden geschieden. ChinaDie Scheidungsrate stieg in den 2000er Jahren ebenfalls auf etwa 3,2 pro 1.000 (44% der Eheschließungen) bis 2018, was die Verstädterung und die Erleichterung von Scheidungsverfahren widerspiegelt - tatsächlich stieg die Zahl der chinesischen Scheidungen in den letzten 16 Jahren bis 2019 jedes Jahr. (Ein neues "Cooling-off"-Gesetz im Jahr 2021 führte zu einem plötzlichen Rückgang der Scheidungsanträge in China, aber es ist umstritten, ob dies von Dauer ist oder die Scheidungen nur verzögert.) Japan Die Scheidungsrate erreichte um 2002 einen Höchststand und ging dann zurück; 2019 liegt die Rate in Japan bei 1,7 pro 1.000, wobei etwa 35% der Ehen, die mit einer Scheidung enden. Unter SüdostasienDie Scheidungsraten sind eher mäßig bis niedrig, was teilweise auf religiöse und kulturelle Normen zurückzuführen ist. Zum Beispiel, Vietnam nur Berichte 0,4 Scheidungen pro 1.000 und ~7% der Ehen, die mit einer Scheidung enden. Indonesien hat trotz des hohen muslimischen Bevölkerungsanteils auch eine niedrige rohe Scheidungsrate (~1,2) (der Islam erlaubt die Scheidung, aber in der Praxis ist sie selten). Südasien hat die niedrigste Scheidungsrate der Welt - Indiens Die rohe Scheidungsrate beträgt nur etwa 0,1 pro 1.000und nur etwa 1% der indischen Ehen enden mit einer rechtsgültigen Scheidung. Diese extrem niedrige Quote wird auf die starke gesellschaftliche Stigmatisierung von Scheidungen, den Druck der Großfamilie und die rechtlichen Hürden in Indien zurückgeführt. Auch andere südasiatische Länder und Länder des Nahen Ostens melden sehr niedrige Scheidungsraten (z. B. Sri Lanka ~0,15 pro 1.000, ein paar Prozent der Eheschließungen). Andererseits gibt es in Teilen des Nahen Ostens höher Scheidungsraten: zum Beispiel, Saudi-Arabien und Kasachstan (ein mehrheitlich muslimisches Land in Zentralasien) sehen beide 30-40% der Ehen, die mit einer Scheidung enden. In den Golfstaaten sind Scheidungen relativ häufig - z. B. Kuwait lag 2010 bei 42% - begünstigt durch freizügige Gesetze für Männer, obwohl Frauen mehr Hindernisse zu überwinden haben. Bemerkenswert, Philippinen (und der Vatikan) sind die einzigen Länder, die wo die Scheidung völlig illegal ist, was im Wesentlichen zu 0% der Ehen, die legal geschieden werden (Annullierungen sind möglich, aber selten). Solche gesetzlichen Verbote sorgen dafür, dass die registrierte Scheidungsrate bei Null liegt, auch wenn es dennoch zu Trennungen kommt.
Afrika
Verlässliche Scheidungsstatistiken für Afrika sind spärlich, aber die verfügbaren Daten deuten darauf hin, dass die Scheidungsraten im Allgemeinen niedriger sind, von einigen Ausnahmen abgesehen. Viele afrikanische Ehen sind gewohnheitsrechtlich oder religiös begründet und können außerhalb des formalen Rechtssystems aufgelöst werden, so dass die offiziellen Scheidungszahlen niedrig sind.
| Land | Daten Jahr | Scheidungen pro 1.000 Personen | Eheschließungen pro 1.000 | % der Ehen, die in Scheidung enden |
|---|---|---|---|---|
| Südafrika | 2009 | 0.6 | 3.5 | 17.1% |
| Ägypten | 2021 | 2.4 | (ca. ~9) | ~25% (geschätzt) |
| Mauritius | 2010 | 1.4 | 8.2 | 17.1% |
| Nigeria | ~2016 | (sehr niedrig) | (hoch) | (<5%) (est.) |
| Marokko/Algerien | ~2018 | ~1-1.5 | ~7-8 | ~15-20% (geschätzt) |
Afrika: In vielen afrikanischen Ländern ist die die rohe Scheidungsrate liegt unter 1 pro 1.000was auf relativ wenige formelle Scheidungen hinweist. Zum Beispiel, Südafrika - einer der besser dokumentierten Fälle - hatte nur 0,6 Scheidungen pro 1.000 im Jahr 2009, was etwa 17% der Ehen, die mit einer Scheidung enden. Mehrere Faktoren tragen zu den niedrigen erfassten Raten bei: die starke gesellschaftliche/religiöse Ablehnung von Scheidungen in Teilen Afrikas, die Prävalenz informeller Trennungen oder polygamer Ehen, die möglicherweise nicht vor Gericht enden, und praktische Schwierigkeiten (insbesondere für Frauen), Scheidungen zu erwirken. In Nordafrika und im Nahen Osten, wo das islamische Recht die Ehe prägt, ist die Scheidung zwar rechtlich zulässig, aber oft an Bedingungen geknüpft. ÄgyptenDie Zahl der Scheidungen ist in den letzten Jahren gestiegen (2,4 pro 1.000 Einwohner im Jahr 2021) - eine der höchsten Raten in Afrika -, da sich die Einstellung langsam ändert, auch wenn die Frauen häufig auf ihre finanziellen Rechte verzichten müssen, um eine Scheidung einzuleiten. Andere afrikanische Länder wie Mauritius (17%) und Marokko (~15-20%) haben ein moderates Verhältnis von Scheidung zu Heirat. Im Allgemeinen legen afrikanische Gesellschaften Wert auf die Stabilität von Ehen, und viele Scheidungen erfolgen ohne offizielle Statistiken (z. B. durch die Ältesten der Gemeinschaft). Es ist erwähnenswert, dass in Teilen des subsaharischen Afrikas, die gewerkschaftliche Instabilität kann hoch sein (aufgrund von Faktoren wie sozioökonomischem Stress oder Verwitwung), die jedoch in den Daten nicht immer als "Scheidung" erfasst werden. Wo Daten vorhanden sind, zeigen sie oft ein Muster: Die städtische und gebildete Bevölkerung hat höhere Scheidungsraten als die ländliche Bevölkerung, was die größere Autonomie der Paare bei der Trennung widerspiegelt.
Ozeanien
Die Scheidungsmuster in Ozeanien ähneln denen der westlichen Länder.
| Land | Daten Jahr | Scheidungen pro 1.000 Personen | Eheschließungen pro 1.000 | % der Ehen, die in Scheidung enden |
|---|---|---|---|---|
| Australien | 2020 | 1,9 (geschätzt) | 4,6 (geschätzt) | ~41% |
| Neuseeland | 2020 | 1,5 (geschätzt) | 3,6 (geschätzt) | ~42% |
| Fidschi / Pazifische Inseln | ~2018 | (niedrig) | (variiert) | (10-20%) (est.) |
Ozeanien: Australien und Neuseeland haben Scheidungsraten, die mit denen Europas und Nordamerikas vergleichbar sind. Ungefähr 40-45% der Ehen in Australien und Neuseeland werden voraussichtlich in einer Scheidung enden. In Neuseeland beispielsweise lag die rohe Scheidungsrate im Jahr 2022 bei 1,6 pro 1.000, und es gab in diesem Jahr etwa 7,6 Scheidungen pro 1.000 bestehende Ehepaare - was ein ähnliches Scheidungsrisiko von etwa 40% bedeutet. In beiden Ländern stieg die Zahl der Scheidungen bis zum Ende des 20. Jahrhunderts an, doch haben sich die Raten in den letzten Jahren stabilisiert oder sind leicht zurückgegangen, da die Heiratsraten sinken. Im Gegensatz dazu haben viele kleinere pazifische Inselstaaten (Fidschi, Samoa usw.) konservativere Familienstrukturen und nur begrenzte Daten, aber anekdotische Hinweise deuten auf eine relativ geringe Scheidungshäufigkeit hin (oft unter 1 pro 1.000).
Anmerkungen zur Tabelle: Die Daten beziehen sich auf das letzte verfügbare Jahr (in Klammern). "% der Ehen, die in einer Scheidung enden" wird berechnet als Scheidungen ÷ Eheschließungen × 100 für das betreffende Jahr (eine Schätzung des lebenslangen Scheidungsrisikos auf hohem Niveau). Die tatsächliche Lebenszeit-Scheidungswahrscheinlichkeit kann geringfügig abweichen, insbesondere in Ländern, die einem raschen Wandel unterliegen. Dennoch ist dieser Prozentsatz ein nützlicher vergleichender Indikator. Wir zitieren für diese Zahlen maßgebliche Quellen, darunter das Demographische Jahrbuch der Vereinten Nationen und nationale Statistikämter. Ganz allgemein, die weltweiten Scheidungsraten reichen von unter 0,5 pro 1.000 (in einigen wenigen Gesellschaften mit geringer Scheidungsrate) bis zu etwa 3-4 pro 1.000 in den Ländern mit den höchsten Scheidungsraten, während der Anteil der Ehen, die mit einer Scheidung enden, von unter 5% bis über 90% reicht, eine erstaunliche Bandbreite, die rechtliche und kulturelle Extreme widerspiegelt.
Höchste und niedrigste Scheidungsraten weltweit
Weltweit ist die höchste rohe Scheidungsraten (pro 1.000 Personen) werden in einer Mischung aus postsowjetischen Staaten, Teilen Europas und einigen anderen Regionen beobachtet. Nach den neuesten UN-Daten sind die höchsten jährlichen Scheidungsraten in folgenden Ländern zu verzeichnen:
- Nordmazedonien: 9,6 Scheidungen pro 1.000 Personen (2023) - ein neuerlicher Anstieg bringt dieses kleine Balkanland an die Spitze (diese ungewöhnlich hohe Rate im Jahr 2023 könnte auf einen Rückstau von Scheidungen nach der Pandemie oder andere Anomalien zurückzuführen sein).
- Malediven: 5,5 pro 1.000 (2020) - In der Vergangenheit wiesen die Malediven extrem hohe Scheidungsraten auf (mit einem Spitzenwert von 10,97 pro 1.000 Einwohner im Jahr 2002, was einen Guinness-Weltrekord darstellt), was auf die kulturellen Normen der Mehrfachheiraten zurückzuführen ist. Selbst in den letzten Jahren liegen die Malediven mit mehr als 5 Scheidungen pro 1 000 Einwohner an der Weltspitze.
- Weißrussland, Georgien, Moldawien: um 3,7-3,8 pro 1.000 (2021-2022). Mehrere ehemalige UdSSR-Republiken führen die Liste an, was die hohe gesellschaftliche Akzeptanz von Scheidungen und den wirtschaftlichen Druck in der postsowjetischen Ära widerspiegelt. In Weißrussland beispielsweise waren es 3,7 und in Moldawien 3,7 Scheidungen pro 1.000 Einwohner.
- Lettland, Litauen: ~2,5-2,9 pro 1.000 (2022). Die baltischen Staaten haben durchweg hohe Scheidungsraten, wobei Lettland mit 2,8 derzeit die höchste in der EU hat.
- Vereinigte Staaten: ~2,3 pro 1.000 (2020) - während die USA früher zu den Spitzenreitern gehörten, ist ihre Rate zurückgegangen und liegt nun im Vergleich zu Osteuropa auf einem moderaten Niveau.
In Bezug auf "Lebenslanges" Scheidungsrisiko (Anteil der Ehen, die mit einer Scheidung enden)Die Spitzenreiter sind leicht unterschiedlich, was den Einfluss der niedrigen Heiratsraten in einigen Ländern verdeutlicht. Zu den Ländern mit den höchsten Scheidungsraten gehören:
- Spanien: ~85% der Ehen enden mit einer Scheidung. Nach der Legalisierung der Scheidung im Jahr 1981 ist die Scheidungsrate in Spanien sprunghaft angestiegen, und da relativ wenige neue Ehen geschlossen werden, ist die Scheidungsrate in den jüngsten Daten extrem hoch.
- Russland: 73-74%; Ukraine: ~71%; Weißrussland: ~60-65% (geschätzt). Diese slawischen Länder haben eine hohe Heiratsfluktuation - viele Eheschließungen, aber noch mehr Scheidungen im Verhältnis zu dieser Zahl.
- Kuba: ~56%; Frankreich: ~51%; Schweden: 50%. Viele westliche Länder bewegen sich um die 50%-Marke, was bedeutet, dass etwa die Hälfte der Ehen schließlich geschieden wird (die oft zitierte Aussage "die Hälfte aller Ehen wird geschieden" trifft in etwa auf die USA, Frankreich, das Vereinigte Königreich usw. zu).
Im Gegensatz dazu ist die niedrigste Scheidungsraten finden sich in Gesellschaften mit rechtlichen oder kulturellen Hindernissen für die Scheidung. Dazu gehören:
- Indien: Nur etwa 1% der Ehen enden mit einer Scheidung. Die rohe Scheidungsrate in Indien (~0,1) gehört zu den niedrigsten, die jemals verzeichnet wurden. Die starke Stigmatisierung und die Erwartung, die Ehe aufrechtzuerhalten, führen zu sehr wenigen Scheidungen.
- Bhutan, Sri Lanka, Vietnam: Nur 5-7% der Ehen enden mit einer Scheidung. In diesen asiatischen Ländern liegt die Scheidungsrate deutlich unter 0,5 pro 1.000. In Sri Lanka beispielsweise liegt die Rate bei 0,15, und Scheidungen erfordern oft langwierige Gerichtsverfahren.
- Kolumbien und viele afrikanische Länder: Häufig 10-20% Scheidungswahrscheinlichkeit. Viele afrikanische und lateinamerikanische Länder mit starkem katholischem oder gemeinschaftlichem Einfluss (z. B. Guatemala, Kongo, Nigeria) melden sehr niedrige Scheidungszahlen.
- Philippinen und Vatikanstadt: 0% (keine legale Scheidung). Auf den Philippinen können Ehen nur durch Annullierung oder Tod beendet werden. Es überrascht daher nicht, dass die offizielle Scheidungsrate praktisch bei Null liegt und das Land in der weltweiten Scheidungsrangliste oft am unteren Ende erscheint.
Abbildung: Weltkarte der Scheidungsprävalenz ("Scheidungswahrscheinlichkeit" nach Land). Wärmere Farben (rot) bedeuten höhere Scheidungsraten oder -wahrscheinlichkeiten, während kühlere Farben (grün) niedrigere Scheidungsraten anzeigen. Grau bedeutet, dass keine ausreichenden Daten vorliegen. Diese Karte zeigt, dass Scheidungen in der ehemaligen UdSSR, in Teilen Europas und Nordamerikas am häufigsten vorkommen, während sie in Südasien, Teilen Afrikas und einigen südostasiatischen Ländern am wenigsten verbreitet sind.
Wie die Karte und die Daten zeigen, Scheidungsraten variieren dramatisch zwischen den Regionen. Im Allgemeinen weisen entwickelte Regionen und solche mit liberaleren sozialen Normen (Europa, Nordamerika, Ozeanien) eine höhere Scheidungsrate auf, während Entwicklungsregionen mit traditionelleren oder restriktiveren Normen (Südasien, Naher Osten, Afrika) niedrigere Raten haben. Es gibt jedoch bemerkenswerte Ausnahmen - so haben beispielsweise die wohlhabenderen ostasiatischen Länder (Japan, Korea) moderate Raten, und einige ärmere Länder (wie die der ehemaligen Sowjetunion) haben aufgrund besonderer historischer Faktoren hohe Raten. Kulturelle Einstellungen, Religion und rechtliche Strukturen haben einen großen Einfluss auf diese Ergebnisse, wie im Folgenden erläutert wird.
Historische Scheidungstrends in den wichtigsten Ländern
Die Scheidungsraten haben sich in vielen Ländern umgekehrte U-Form in den letzten mehr als 50 Jahren: starker Anstieg in den 1970er bis 1990er Jahren, dann Abflachung oder Rückgang in den 2000er Jahren. Der Zeitpunkt und die Höhe des Höchststandes variieren von Land zu Land und spiegeln unterschiedliche gesellschaftliche Veränderungen wider. Die nachstehende Abbildung 1 zeigt die Entwicklung der Scheidungsraten für eine Reihe von Ländern auf allen Kontinenten und verdeutlicht diese unterschiedlichen Muster.
Abbildung 1: Entwicklung der Scheidungsrate (Scheidungen pro 1.000 Personen pro Jahr) für ausgewählte Länder, 1960-2020. Viele westliche Länder (z. B. Vereinigte Staaten, Vereinigtes Königreich, Norwegen) stiegen die Scheidungsraten ab den 1960er Jahren, erreichten ihren Höhepunkt in den 1970er bis 1980er Jahren und gingen dann zurück. In einigen ostasiatischen und osteuropäischen Ländern (Südkorea, Estland, Polen) erreichten ihren Höhepunkt später (etwa Anfang der 2000er Jahre), als Scheidungen zunehmend akzeptiert wurden. Andere wie Türkei zeigen einen stetigen Anstieg bis in die 2010er Jahre, ausgehend von einer niedrigen Basis. (Datenquelle: OECD/UN, über Unsere Welt in Daten.)
In der Vereinigte StaatenIn den USA stieg die rohe Scheidungsrate von ~2,2 im Jahr 1960 auf einen historischen Höchststand von 5,3 pro 1.000 im Jahr 1981, nachdem die Gesetze zur Scheidung ohne Verschulden eingeführt worden waren und sich die Geschlechterrollen verändert hatten. Seitdem ist sie stetig gesunken - 2021 lag sie bei 2,5, dem niedrigsten Stand seit 50 Jahren. Dieser Rückgang wird zum Teil darauf zurückgeführt, dass jüngere Generationen später und gezielter heiraten, was zu stabileren Ehen führt. Das Scheidungsrisiko für erste Ehen in den USA ist etwas gesunken (derzeit schätzungsweise 40-45% insgesamt). Ähnlich, Kanada und Australien verzeichneten in den 1980er Jahren Spitzenwerte und danach einen Rückgang. In Australien beispielsweise stieg die Scheidungsrate nach der Einführung der verschuldensunabhängigen Scheidung im Jahr 1975 sprunghaft an und stabilisierte sich dann; der Prozentsatz der Ehen, die mit einer Scheidung enden, ist in Australien sogar gesunken unten von etwa 50% in den 1980er Jahren auf ~41% heute.
Unter WesteuropaIn den meisten Ländern sind die Scheidungsraten zwischen 1970 und 1990 stark angestiegen. Die UK erreichte Mitte der 1990er Jahre mit ~3 Scheidungen pro 1.000 einen Höchststand (nach einer Reform in den 1990er Jahren, die Scheidungen erleichterte) und ist seitdem auf ~1,8 gesunken. Skandinavisch Länder hatten mit die frühesten Anstiege zu verzeichnen (z. B. erreichte Schweden in den 1980er Jahren ~2,5 pro 1.000 und liegt weiterhin bei 2,0-2,5). Südeuropa wurde verzögert - Länder wie Italien, Spanien und Portugal hatten sehr niedrige Scheidungsraten, bis die Scheidung legal wurde (Spanien 1981, Portugal 1975, Italien 1970). Nach der Legalisierung kam es in diesen Ländern zu einem steilen Anstieg: In Spanien stieg die Scheidungsrate besonders stark an, nachdem ein Gesetz aus dem Jahr 2005 die Verfahren erleichterte, was zu den derzeit hohen Scheidungsquoten beitrug. Auch in Portugal stieg die Zahl der Scheidungen in den 1990er bis 2000er Jahren rapide an. Interessanterweise haben einige westliche Länder in letzter Zeit rückläufig Scheidungsraten: z.B. Deutschland, die Niederlande, Frankreich haben alle seit Anfang der 2000er Jahre einen leichten Rückgang der rohen Scheidungsraten zu verzeichnen. Dies wird häufig darauf zurückgeführt, dass weniger Menschen überhaupt heiraten (so dass sich weniger Menschen scheiden lassen können), dass möglicherweise mehr Menschen zusammenleben und dass das Heiratsalter steigt (was das Scheidungsrisiko senkt). Die Website EU als Ganzes erreichte die Scheidungsrate um 2006 mit 2,1 ihren Höchststand und ging dann bis 2019 leicht auf 1,8-2,0 zurück.
Unter Osteuropa und die ehemalige UdSSRIn den 1990er Jahren führte der Übergang zu einer sehr hohen Scheidungsrate. Russland und Ukraine erreichte in den 1990er- bis 2000er-Jahren mit rohen Raten von etwa 4-5 pro 1.000 ihren Höhepunkt, was die sozialen Unruhen und die neuen Freiheiten der postsowjetischen Ära widerspiegelt. Seitdem hat sich die Rate in Russland auf etwa 3,9 (ab 2020) verringert, bleibt aber im Vergleich zu den Eheschließungen hoch. In den baltischen Staaten (Estland, Lettland, Litauen) stieg die Scheidungsrate Ende der 1990er Jahre sprunghaft an und ist nach wie vor hoch (Lettlands Rate von 2,8 im Jahr 2023 ist eine der höchsten in Europa). In einigen osteuropäischen Ländern ist die Scheidungsrate in letzter Zeit zurückgegangen (z. B. Polen erreichte um 2006 ihren Höhepunkt und ging dann leicht zurück), was wahrscheinlich auf die kulturelle Betonung der Familie und weniger Eheschließungen unter jüngeren Menschen zurückzuführen ist (Polen hat immer noch eine der höchsten Heiratsraten in Europa).
Asiens Trends sind vielfältig. Japans Die Scheidungsrate stieg nach dem Zweiten Weltkrieg allmählich an, erreichte 2002 einen Wert von ~2,1 und ging dann bis 2019 auf ~1,6-1,7 zurück, da die Bevölkerung altert und weniger junge Menschen heiraten. Südkorea hatte einen späteren, aber stärkeren Anstieg zu verzeichnen: Die Scheidungsrate verdreifachte sich von 1,1 im Jahr 1990 auf ~3,5 im Jahr 2003, fiel dann bis 2010 auf ~2,2 und hat sich seitdem eingependelt. Dieses Muster - ein Höchststand und dann ein Rückgang - in Korea und Japan lässt sich zum Teil durch den Generationswechsel erklären (die Kohorte, die in den 1980er- und 1990er-Jahren heiratete, hatte hohe Scheidungsraten, aber die jüngeren Kohorten heiraten weniger und sind etwas stabiler). China ist durch einen stetigen Anstieg der Scheidungsrate in den 2000er Jahren gekennzeichnet: Von einem sehr niedrigen Niveau in den 1980er Jahren stieg die rohe Scheidungsrate in China bis 2018 auf 3,2. Die jüngste Einführung einer 30-tägigen Wartezeit durch die chinesische Regierung im Jahr 2021 führte zu einem gemeldeten Rückgang der registrierten Scheidungen um 70% unmittelbar danach, was jedoch eher auf verzögerte oder nicht registrierte Trennungen als auf eine echte Verhaltensänderung hindeuten könnte (einige chinesische Paare beeilten sich mit der Scheidung vor das Gesetz, ein Anstieg der Zahlen im Jahr 2020, dann ein Rückgang im Jahr 2021). Langfristig spiegelt der Trend in China den zunehmenden Individualismus und die geringere Stigmatisierung von Scheidungen in städtischen Gebieten wider. Unter IndienIm Gegensatz dazu ist die Scheidungsrate im Laufe der Zeit konstant niedrig geblieben - es gibt keinen vergleichbaren "Scheidungsboom", und das historische Stigma hat die Raten nahe Null gehalten (obwohl die Scheidungsrate im städtischen Indien in den letzten Jahren langsam ansteigt).
Viele Nahost und Nordafrikanisch Ländern fehlen langfristige Daten, aber einige (wie Ägypten und Jordanien) zeigen steigende Scheidungszahlen in den 2010er Jahren, was wahrscheinlich auf allmähliche soziale Veränderungen und Rechtsreformen zurückzuführen ist. So stieg die Scheidungsrate in Ägypten im Laufe der 2010er Jahre an und erreichte im Jahr 2021 einen Höchststand (2,4 pro 1 000). Golfstaaten wie die Vereinigten Arabischen Emirate, Katar und Kuwait hatten Berichten zufolge in den 1990er bis 2000er Jahren hohe Scheidungsraten (wobei Katar um 2005 mit ~2,2 pro 1.000 seinen Höhepunkt erreichte und Kuwait sogar noch höher lag), gefolgt von einer gewissen Stabilisierung. Diese Trends fallen häufig mit der Modernisierung und der besseren Bildung der Frauen zusammen, was zu einer größeren Bereitschaft führt, unglückliche Ehen zu beenden.
Unter AfrikaDie historischen Daten sind begrenzt. Anekdotische Hinweise deuten jedoch darauf hin, dass in einigen Ländern des südlichen Afrikas Scheidungen nach 2000 häufiger geworden sind (z. B. Botswana und Südafrika In den 1990er Jahren war ein Anstieg zu verzeichnen, danach ein leichter Rückgang). In Südafrika sind die registrierten Scheidungen seit 2004 langsam zurückgegangen, was möglicherweise auf weniger formelle Eheschließungen und mehr Lebensgemeinschaften zurückzuführen ist. Im Gegensatz dazu sind Länder wie Äthiopien oder Nigeria haben historisch gesehen immer noch eine sehr niedrige formale Scheidungshäufigkeit, obwohl die Trennungsraten höher sein könnten.
Zusammenfassend lässt sich sagen, dass die großen Industrieländer den Höhepunkt der "Scheidungsrevolution" größtenteils hinter sich gelassen haben - die Scheidungsraten, die im späten 20. Jahrhundert angestiegen waren, sind im 21. Die Entwicklungsländer befinden sich in unterschiedlichen Stadien: Einige (insbesondere Ostasien und Teile Lateinamerikas) erlebten ihren Scheidungsanstieg in den 2000er Jahren und pendeln sich nun ein, während andere (Südasien, Teile Afrikas) aufgrund anhaltender kultureller Zwänge noch keinen signifikanten Anstieg zu verzeichnen haben.
Regionale und wirtschaftliche Muster
Beim Vergleich zwischen Kontinente und WirtschaftsgruppenBei der Scheidungsprävalenz lassen sich klare Muster erkennen:
- Europa und Nordamerika: Diese Regionen mit hohem Einkommen haben mittlere bis hohe Scheidungsraten. Die durchschnittliche rohe Scheidungsrate in den OECD-Ländern mit hohem Einkommen beträgt etwa 1,8 pro 1.000 in den letzten Jahren. Innerhalb Europas liegt der EU-Durchschnitt bei ~2,0. Nahezu alle westlichen Länder lassen Scheidungen ohne Verschulden zu und haben minimale rechtliche Hindernisse, was zu einer hohen Scheidungsrate führt. Allerdings gibt es auch innerhalb dieser Gruppe Unterschiede: In Nord- und Westeuropa (sowie in Nordamerika/Ozeanien) liegt die Scheidungsrate in der Regel bei 40-50%, während sie in traditionell katholischen oder orthodoxen Ländern (Irland, Polen, Italien) niedriger ist, allerdings mit steigender Tendenz. Wirtschaftliche Entwicklung und Urbanisierung korrelieren in der Regel mit höheren Scheidungsraten, da die finanzielle Unabhängigkeit der Frauen und die sozialen Sicherheitsnetze das Verlassen einer Ehe leichter machen. In der Tat haben Studien ergeben, dass Länder mit höherer Bildung und höherer Erwerbsbeteiligung der Frauen im Allgemeinen höhere Scheidungsraten aufweisen. Dies ist z. B. in Skandinavien (hohe Gleichstellung der Geschlechter, relativ hohe Scheidungsrate) im Vergleich zu weniger entwickelten Regionen zu beobachten. Gleichzeitig kann eine extrem hohe Scheidungsrate auch auf Folgendes zurückzuführen sein soziale Zerrüttung - Russland und seine Nachbarländer (Länder mit mittlerem Einkommen) übertreffen beispielsweise viele reichere Länder bei den Scheidungsraten, was auf die sozioökonomischen Zwänge und den schwächeren religiösen Einfluss auf die Politik zurückzuführen ist.
- Asien: Asien lässt sich nicht verallgemeinern, denn es umfasst sowohl einige der niedrigste und höchste Scheidungsgesellschaften. Im Allgemeinen, Ostasien und Zentralasien Länder (z. B. Korea, China, Kasachstan) haben heute Scheidungsraten, die mit denen westlicher Länder vergleichbar sind. Im Gegensatz dazu, Südasien (Indien, Bangladesch, Pakistan) Die Zahl der Scheidungen ist aufgrund kultureller Normen (patriarchalische Familiensysteme, Stigmatisierung, Traditionen der arrangierten Ehe) nach wie vor äußerst gering. Südostasien liegt dazwischen: In überwiegend muslimischen Ländern wie Indonesien und Malaysia ist die Zahl der Scheidungen gering, obwohl das islamische Recht es Männern erlaubt, sich relativ leicht scheiden zu lassen (was zu einem Anstieg informeller Scheidungen führen kann). In diesen Regionen halten der familiäre Zusammenhalt und die soziale Scham im Zusammenhang mit Scheidungen die Raten niedrig. Zum Beispiel, Vietnam und Thailand haben niedrige Quoten, zum Teil weil die Großfamilie oft bei Eheproblemen vermittelt. Wirtschaftliche Faktoren spielen ebenfalls eine Rolle - in den ärmeren Agrargesellschaften Asiens sind die Scheidungsraten niedriger, weil die Familie eine wirtschaftliche Einheit ist und den Frauen möglicherweise Unterstützung außerhalb der Ehe fehlt. In dem Maße, wie die Wirtschaft wächst und Frauen neue Möglichkeiten erhalten, nehmen Scheidungen jedoch tendenziell zu (z. B. fiel der rasche Anstieg der Scheidungen im städtischen China mit der wirtschaftlichen Liberalisierung zusammen). Vor allem Länder mit restriktiven Scheidungsgesetzen (wie bisher die Philippinen) oder langen Trennungszeiten weisen naturgemäß niedrige Raten auf.
- Naher Osten und Nordafrika: In dieser Region sind die Scheidungsraten mäßig, wobei sie stark schwanken. In den arabischen Golfstaaten (z. B. Kuwait, Katar, Vereinigte Arabische Emirate) und den nordafrikanischen Ländern liegen die Raten im Allgemeinen bei etwa 1 bis 2 pro 1.000 - nicht so hoch wie in Europa, aber höher als in Südasien. Kulturelle Normen halten Frauen stark davon ab, eine Scheidung zu initiieren, aber die Möglichkeit des Mannes, sich von seiner Frau loszusagen (nach islamischem Recht), kann zu höheren Scheidungsraten führen, die von Männern initiiert werden. Ungleichheit zwischen den Geschlechtern eine Rolle: Ironischerweise sind einige Länder des Nahen Ostens, die eine große Ungleichheit zwischen den Geschlechtern aufweisen auch haben relativ hohe Scheidungsraten (weil Männer sich frei scheiden lassen können, während Frauen die Konsequenzen tragen müssen). Umgekehrt kann die sehr niedrige Scheidungsrate in Ländern wie Jemen oder Syrien sowohl den sozialen Druck als auch die Schwierigkeiten der Frauen widerspiegeln, eine Scheidung zu erwirken. In den letzten Jahren hat die Modernisierung die Scheidungsrate in den liberaleren Teilen der Region (z. B. Tunesien, Iran, Türkei) leicht ansteigen lassen, da die Rechtsreformen die Scheidung erleichtern und die Frauen einen höheren Bildungsgrad erreichen. In der Türkei beispielsweise liegt die Scheidungsrate zwar nur bei 1,7 pro 1.000, aber sie steigt schleichend an, da sich die traditionellen Familienstrukturen verändern.
- Lateinamerika: In den lateinamerikanischen Ländern waren die Scheidungsraten aufgrund des katholischen Einflusses traditionell niedrig (in vielen Ländern war die Scheidung bis zum Ende des 20. Jahrhunderts verboten). In den letzten paar Jahrzehnten, Die Scheidung ist in ganz Lateinamerika legal geworden und wird immer häufiger durchgeführt.In den meisten lateinamerikanischen Ländern liegen die rohen Scheidungsraten bei etwa 1-2 pro 1.000 (z. B. Brasilien ~1,4; Kolumbien ~0,7; Costa Rica 2,6). Kuba ist ein bemerkenswerter Ausreißer mit einer der höchsten Scheidungsraten der Welt (über 2,5 pro 1.000 und >50% der Ehen werden geschieden), was oft auf die säkulare, sozial liberale Politik seit der kubanischen Revolution zurückgeführt wird. Die Dominikanische Republik und Puerto Rico haben ebenfalls relativ hohe Raten von 2,4 bis 2,6 pro 1.000. Auf der anderen Seite haben kulturell konservative Länder wie Chile und Peru bleiben niedrig (in Chile stieg die Rate erst in den 2010er Jahren auf über 1,0 pro 1.000, nachdem die Scheidung legalisiert wurde). Mit der Verstädterung Lateinamerikas und der Verbesserung der Rechte der Frauen nimmt die Scheidungsrate allmählich zu, bleibt aber aufgrund der familienzentrierten Kultur unter dem westlichen Niveau. Das ist wichtig, informelle Trennungen und einvernehmliche Ehen sind in Lateinamerika weit verbreitet, was sich möglicherweise nicht in den Scheidungsstatistiken widerspiegelt - viele Paare trennen sich einfach, ohne sich rechtlich scheiden zu lassen, oder haben nie offiziell geheiratet, was die offiziellen Zahlen beeinflusst.
- Afrika: Afrika ist die Region mit den wenigsten Daten, aber die traditionellen Normen begünstigen die Stabilität der Ehe. Viele afrikanische Länder haben ein duales Ehesystem (zivil- und gewohnheitsrechtlich); Scheidungen nach Gewohnheitsrecht werden möglicherweise nicht offiziell gezählt. Dort, wo Daten vorliegen (Südafrika, Ägypten, Mauritius, Kenia), liegen die Rohdaten in etwa bei 0,5 bis 2,0. Im Allgemeinen, Afrika südlich der Sahara verzeichnet niedrige Scheidungsraten. So sind die gemeldeten Raten in Nigeria und Äthiopien extrem niedrig. Eine Ausnahme war Botswanadie in den 1990er Jahren eine für Afrika ungewöhnlich hohe Scheidungsrate aufwiesen (über 10% der Ehen endeten mit einer Scheidung, was möglicherweise auf die matrilineare Sozialstruktur zurückzuführen ist), aber die Daten sind begrenzt. In afrikanischen Gesellschaften wirken Faktoren wie der Brautpreis (Mitgift) und die Vermittlung durch die Gemeinschaft einer Scheidung entgegen. Polygamie und nichteheliches Zusammenleben können jedoch zu Beziehungsauflösungen führen, die nicht als "Scheidung" erfasst werden. Bemerkenswert ist, dass die Scheidungsraten in afrikanischen Ländern mit höherer weiblicher Alphabetisierung und Beschäftigung (z. B. Südafrika, Mauritius) tendenziell etwas höher sind als in Ländern, in denen Frauen weniger Autonomie haben. Dennoch sind selbst in Südafrika die Scheidungsraten im Vergleich zu westlichen Ländern bescheiden. Wirtschaftlicher Stress kann in beide Richtungen wirken: Sie führt manchmal zum Auseinanderbrechen von Familien, kann aber auch dazu führen, dass die Ehe zu einer notwendigen wirtschaftlichen Partnerschaft wird, die die Menschen nur ungern verlassen.
Von einem Wirtschaftssystematik Perspektive, Volkswirtschaften mit hohem Einkommen berichten im Durchschnitt über eine höhere Scheidungshäufigkeit als Volkswirtschaften mit niedrigem Einkommen. In den Industrieländern gibt es nicht nur höhere offizielle Scheidungsraten, sondern auch liberalere Gesetze und soziale Sicherheitsnetze zur Unterstützung geschiedener Personen. Im Gegensatz dazu ist die Ehe in Ländern mit niedrigem Einkommen oft mit der Familienehre, der finanziellen Sicherheit der Frauen und dem sozialen Ansehen verbunden, was Scheidungen unterdrückt. So schneiden die 10 Länder mit den niedrigsten Scheidungsraten auf dem UN-Index für geschlechtsspezifische Ungleichheit alle schlecht ab (was auf traditionellere, restriktive Rollen für Frauen hinweist). Dies legt nahe, dass sehr niedrige Scheidungsraten können ein Zeichen für eine eingeschränkte Selbstbestimmung der Frau oder für rechtliche Hürden sein und nicht für das Glück in der Ehe. Tatsächlich zeigt ein Vergleich, dass viele Länder mit den niedrigsten Scheidungsraten (z. B. Usbekistan, die Mongolei, Pakistan) bei der Gleichstellung der Geschlechter einen niedrigen Rang einnehmen, während unter den Ländern mit den höchsten Scheidungsraten einige relativ gleichberechtigt sind (z. B. Schweden, Belgien), einige jedoch nicht (Russland, Belarus). Kurz und gut, Größere persönliche Freiheiten und die Gleichstellung der Geschlechter führen bis zu einem gewissen Grad zu höheren Scheidungsraten.Aber extrem hohe Scheidungsraten können auch auf soziale Instabilität oder sich entwickelnde Normen in Ländern mit mittlerem Einkommen zurückzuführen sein. Gesellschaften mit hohen Scheidungsraten weisen ein unterschiedliches wirtschaftliches Niveau auf, haben aber eines gemeinsam: die kulturelle Akzeptanz der Beendigung von Ehen. In den Gesellschaften mit den niedrigsten Scheidungsraten gibt es dagegen oft strenge rechtliche/religiöse Auflagen oder soziale Sanktionen im Zusammenhang mit Scheidungen.
Sozialer, rechtlicher und kultureller Kontext
Scheidungen finden nicht im luftleeren Raum statt - sie sind stark von den Normen, Gesetzen und Einstellungen einer Gesellschaft zur Ehe beeinflusst. Hier untersuchen wir, wie soziale, rechtliche und kulturelle Faktoren die Unterschiede in den Scheidungsraten beeinflussen:
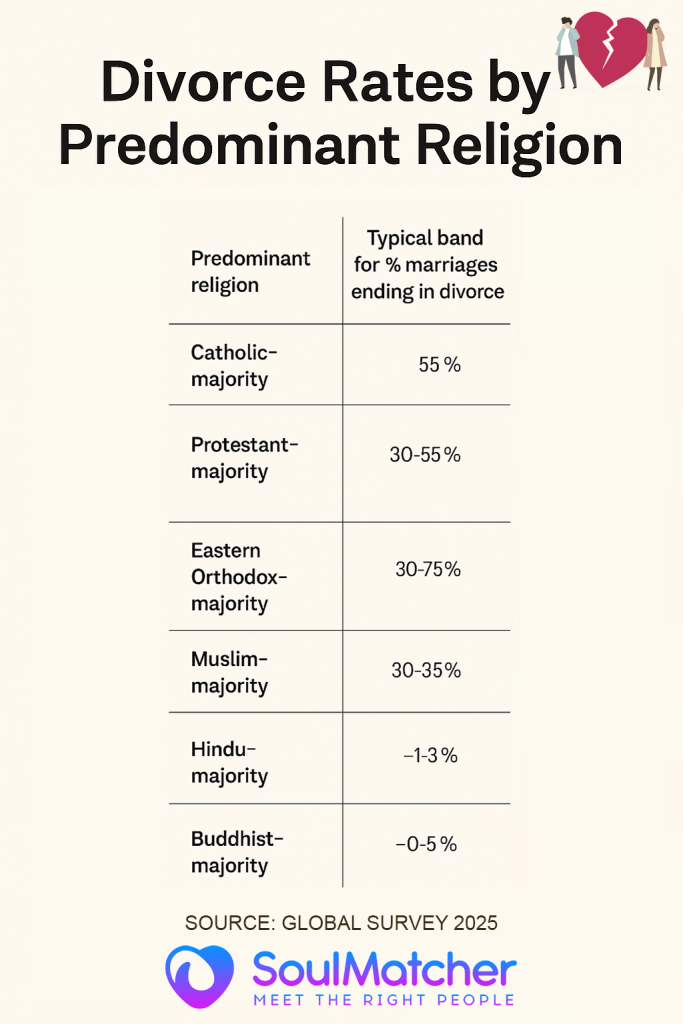
- Kulturelle/religiöse Normen: Die vielleicht stärkste Determinante für die Scheidungsrate ist die kulturelle Einstellung zur Dauerhaftigkeit der Ehe. In Gesellschaften, in denen die Ehe als heiliger, unauflöslicher Bund angesehen wird (der oft religiös untermauert ist), sind Scheidungen selten. Zum Beispiel in Indien und vielen Ländern mit muslimischer Mehrheit ist eine Scheidung mit einem erheblichen Stigma behaftet. Familien können Paare unter Druck setzen, zusammenzubleiben, selbst in unglücklichen oder missbräuchlichen Situationen, um Schande zu vermeiden. In Indien gilt die Ehe oft als "lebenslang", und eine Scheidung kann mit einem so starken sozialen Stigma verbunden sein, dass nur ~1% der Ehen zerbrechen. Ähnlich verhält es sich in historisch überwiegend katholischen Ländern (z. B. Philippinen, Irland, Polen) hielt die religiöse Doktrin gegen Scheidungen die Raten extrem niedrig, bis es zu gesetzlichen Änderungen kam. Im Gegensatz dazu sind die Scheidungsraten in Kulturen, in denen das individuelle Glück und die persönliche Entfaltung im Vordergrund stehen, tendenziell höher. In weiten Teilen Europas und Nordamerikas sind Scheidungen heute zwar bedauerlich, aber gesellschaftlich akzeptiert und relativ häufig. Diese Akzeptanz hat seit den 1960er Jahren aufgrund der Säkularisierung erheblich zugenommen. Zum Beispiel hat der zunehmende Säkularismus in Westeuropa korrespondiert mit mehr Scheidungen (z. B. Spaniens Der Übergang von einer katholischen Diktatur zu einer säkularen Demokratie im späten 20. Jahrhundert führte dazu, dass die Zahl der Scheidungen auf 85% der Eheschließungen anstieg). Konfuzianisch geprägte ostasiatische Länder (China, Korea, Japan) legten traditionell großen Wert auf den Zusammenhalt der Familie und wiesen eine niedrige Scheidungsrate auf. Mit der Modernisierung und dem zunehmenden Individualismus dieser Gesellschaften verloren Scheidungen jedoch etwas von ihrem Tabu, wie der Anstieg in Südkorea in den frühen 2000er Jahren und der stetige Anstieg in China zeigen. Es ist bemerkenswert, dass selbst innerhalb eines Landes Scheidungen in städtischen, säkularen Bevölkerungsgruppen häufiger vorkommen als in religiösen oder ländlichen Gemeinschaften. Zum Beispiel in den Vereinigte StaatenDie Scheidungsraten in evangelikalen christlichen Gemeinden liegen aufgrund der religiösen Ablehnung von Scheidungen oft etwas unter dem nationalen Durchschnitt, während sie in liberaleren Gemeinden höher sind.
- Rechtszugang und Reformen: Die Leichtigkeit oder Schwierigkeit, eine Scheidung zu erwirken, ist ein entscheidender Faktor. Wo die Scheidung illegal oder stark eingeschränktDie Preise sind natürlich extrem niedrig. Das haben wir in der Philippinen und VatikanstadtIn Ländern, in denen eine Scheidung nicht zulässig ist, liegt die offizielle Quote bei Null. In Ländern, in denen eine lange Trennungszeit, bestimmte Gründe (verschuldensabhängige Scheidung) oder gegenseitiges Einverständnis erforderlich sind, ist die Scheidungsrate in der Regel niedriger als in Ländern mit schneller, verschuldensunabhängiger Scheidung. Zum Beispiel, Malta verlangte bei der Legalisierung der Scheidung im Jahr 2011 zunächst eine vierjährige Trennungszeit, was die Scheidungsraten zunächst niedrig hielt. Irland hat immer noch eine vorgeschriebene Trennungszeit (die kürzlich von vier auf zwei Jahre verkürzt wurde), was zum Teil seine niedrige Rate (~15%) erklärt. Im Gegensatz dazu haben die Länder mit schnelle Scheidungsverfahren ohne Schuldfrage haben tendenziell höhere Raten. Die Einführung von Gesetzen zur Scheidung ohne Verschulden in Ländern wie den USA (1970er Jahre) und Australien (1975) führte zu einem sofortigen Anstieg der Scheidungsanträge, da die Paare kein Fehlverhalten mehr nachweisen mussten. Heute lassen die meisten westlichen Länder Scheidungen in gegenseitigem Einvernehmen und ohne Angabe von Gründen zu, was zu einer Normalisierung der Scheidungsrate führt. Einige Länder sind sogar dabei, die Verfahren zu vereinfachen (z. B. Norwegen und Schweden erlauben die Online-Einreichung nach einer kurzen Wartezeit). Einer vergleichenden Analyse zufolge gehören zu den Ländern mit den einfachsten und am wenigsten aufwändigen Scheidungsverfahren Norwegen, Schweden, Spanien, Mexiko, Slowenien, Argentiniendie alle erwartungsgemäß mittlere bis hohe Scheidungsraten aufweisen. Umgekehrt haben Länder mit sehr komplexen Scheidungsgesetzen - zum Beispiel, Pakistan (wobei Frauen vor Gericht gehen und Gründe nachweisen müssen, während Männer einseitig ablehnen können) oder Ägypten (wo Frauen für eine verschuldensunabhängige "khula"-Scheidung ihre finanziellen Rechte aufgeben müssen) - weniger Scheidungen oder mehr von Männern eingereichte Scheidungsanträge verzeichnen. Rechtsreformen können sich unmittelbar auf die Statistik auswirken: Chile gab es bis 2004 praktisch keine legalen Scheidungen; nach der Legalisierung führte der Nachholbedarf dazu, dass Tausende von Scheidungen registriert wurden, was die Quote in die Höhe trieb. Brasilien verzeichnete einen Anstieg, nachdem die vorgeschriebene Trennungszeit im Jahr 2010 abgeschafft wurde. Unter ChinaDas jüngste Gesetz über die Bedenkzeit scheint die Zahl der Scheidungen vorübergehend gesenkt zu haben, indem es den Prozess erschwert hat. Es spielt also eine große Rolle, wie scheidungsfreundlich oder scheidungsfeindlich das Rechtssystem ist.
- Rechte der Frauen und wirtschaftliche Unabhängigkeit: Ein durchgängiges Ergebnis ist, dass Die Scheidungsraten steigen mit der zunehmenden sozioökonomischen Macht der Frauen. Wenn Frauen eine Ausbildung, eine berufliche Laufbahn und gesetzliche Rechte haben, ist die Wahrscheinlichkeit geringer, dass sie unglückliche oder unterdrückende Ehen tolerieren. Historisch gesehen waren Scheidungen in Gesellschaften, in denen Frauen weder Eigentum besitzen noch für ihren Lebensunterhalt aufkommen konnten, selten, da sie die Frauen oft in die Armut oder ins soziale Exil stürzten. Als diese Schranken fielen, nahmen die Scheidungen zu. Die Zunahme der Scheidungen in der westlichen Welt in den 1970er Jahren hängt beispielsweise mit der Frauenbefreiungsbewegung und der zunehmenden Berufstätigkeit von Frauen zusammen (die U.S. erreichten die Scheidungen ihren Höhepunkt, als eine große Zahl von Frauen ins Berufsleben eintrat und sich die Normen für die Ehe änderten). In Ostasien verlief der Anstieg der Scheidungen in den 1990er- bis 2000er-Jahren parallel zu einer höheren Bildung und Erwerbsbeteiligung von Frauen in Südkorea, China, Taiwanusw. Im Nahen Osten zeigen die Daten, dass Länder mit höherer weiblicher Alphabetisierung (z. B. Iran, Türkei) haben höhere Scheidungsraten als Länder, in denen die Frauen weniger Macht haben (z. B. Jemen, wo die Scheidungsrate sehr niedrig ist). Es gibt eine klare geschlechtsspezifische Dimension: vielerorts, Frauen leiten häufiger eine Scheidung ein als Männer wenn sie dazu in der Lage sind - zum Beispiel werden etwa 70% der Scheidungen in den USA von Frauen eingereicht, ein Muster, das auch in anderen Industrieländern zu beobachten ist, was darauf hindeutet, dass Frauen mit zunehmender Unabhängigkeit eher bereit sind, unbefriedigende Ehen zu beenden. In Ländern, in denen Scheidungen (aufgrund von Gesetzen oder Normen) überwiegend von Männern initiiert werden, wie in Teilen der arabischen Welt, haben Scheidungen möglicherweise eine andere soziale Bedeutung (manchmal können hohe Raten darauf hindeuten, dass Männer sich häufig scheiden lassen und wieder heiraten). Insgesamt tragen verbesserte gesetzliche Rechte (z. B. Gesetze zum ehelichen Eigentum, Durchsetzung von Kindergeld) und soziale Unterstützung (z. B. weniger Stigmatisierung geschiedener Frauen) zu höheren Scheidungsraten bei, indem sie praktische Hindernisse beseitigen.
- Wirtschaftlicher Stress und Urbanisierung: Widersinnigerweise können sowohl Wohlstand als auch Armut die Scheidung auf unterschiedliche Weise beeinflussen. Wirtschaftliche Stabilität kann eine Scheidung erleichtern, weil die Partner nicht gezwungen sind, zusammenzubleiben, um zu überleben. Gleichzeitig wirtschaftliche Belastung (Arbeitslosigkeit, Inflation) können Ehen belasten und zum Scheitern bringen. Nach dem Zusammenbruch der Sowjetunion zum Beispiel trugen die wirtschaftlichen Turbulenzen wahrscheinlich zur Instabilität der Ehen bei - in Russland stieg die Scheidungsrate während der Wirtschaftskrise der 1990er Jahre sprunghaft an. In Griechenland nahmen die Scheidungen Berichten zufolge während der jüngsten Finanzkrise zu. Auf der anderen Seite können Rezessionen auch vorübergehend unter Scheidungsraten, wenn Paare kostspielige Gerichtsverfahren hinauszögern oder sich eine Trennung der Haushalte nicht leisten können. Dies zeigte sich in der weltweiten Rezession 2008, als in einigen Ländern ein leichter Rückgang der Scheidungsrate zu verzeichnen war. Urbanisierung führt tendenziell zu mehr Scheidungen: In Städten ist die traditionelle Familienaufsicht schwächer, und die Menschen sind vielfältigeren Lebensstilen (und Versuchungen) ausgesetzt. Städte bieten auch mehr Anonymität und Unterstützungsnetze für Geschiedene. So sind die höchsten Scheidungsraten in China in Großstädten wie Shanghai und Peking zu verzeichnen, während in ländlichen Dörfern weitaus weniger Scheidungen stattfinden.
- Gesellschaftliche Erwartungen im Wandel: An moderne Ehen werden oft andere Erwartungen gestellt (emotionale Erfüllung, geteilte Rollen) als an traditionelle utilitaristische Ehen. Mit steigenden Erwartungen, so argumentieren einige Wissenschaftler, sinkt die Toleranz für eine unbefriedigende Ehe, was zu mehr Scheidungen führt. Dies wurde im Zusammenhang mit den USA angeführt: Der Wandel hin zu Ehen, die auf Liebe und Selbstverwirklichung basieren, kann zu mehr Scheidungen führen, wenn diese Bedürfnisse nicht erfüllt werden. Die jüngeren Jahrgänge weltweit haben im Allgemeinen eine liberalere Einstellung zur Scheidung als ihre Eltern, was die Scheidung allmählich normalisiert. A UN-Gesamtüberblick stellte fest, dass in den 2000er Jahren doppelt so viele Menschen wie in den 1970er Jahren mit Ende 30 geschieden/getrennt wurden - was nicht nur auf rechtliche Veränderungen, sondern auch auf die gesellschaftliche Akzeptanz der Tatsache zurückzuführen ist, dass man nicht in einer unglücklichen Ehe bleiben muss. Darüber hinaus kann der Rückgang arrangierter Ehen und die Zunahme von Liebesheiraten in Regionen wie Asien paradoxerweise zu mehr Scheidungen führen: Wenn Menschen ihre Partner aus Liebe wählen, können sie sich auch dafür entscheiden, sie zu verlassen, wenn die Liebe nachlässt, während arrangierte Ehen mit einem stärkeren familiären Druck verbunden waren, weiter zu bestehen.
- Auswirkungen des Zusammenlebens: In vielen westlichen Ländern sind die Konkubinat (unverheiratetes Zusammenleben) hat die Scheidungsstatistiken beeinflusst. Das Zusammenleben kann als "Ehe auf Probe" oder als Alternative zur Ehe dienen. In einigen Ländern (z. B. Schweden, Frankreich), leben viele Paare zusammen und haben sogar Kinder, ohne zu heiraten. Einige dieser Partnerschaften werden aufgelöst, ohne jemals in die Scheidungsstatistik aufgenommen zu werden. Das Zusammenleben hat zum Rückgang der Heiratsraten beigetragen, was wiederum zu einem Rückgang der Scheidungsraten führen kann (da zu Beginn weniger Menschen heiraten). Das Zusammenleben kann jedoch in beide Richtungen wirken: Es kann schwächere Beziehungen vor der Ehe ausmerzen (was zu stabileren Ehen führt), oder es kann eine Verschiebung widerspiegeln, bei der diejenigen, die geheiratet hätten und sich dann scheiden ließen, einfach zusammenleben und sich stattdessen trennen. Insgesamt ist die Zunahme des Zusammenlebens in Europa und Amerika ein Grund dafür, dass sich die Scheidungsraten in letzter Zeit eingependelt haben oder sogar gesunken sind - manche Trennungen zählen einfach nicht als "Scheidungen".
- Politik und Unterstützungssysteme: Einige Regierungen setzen aktiv politische Maßnahmen um, die sich auf Scheidungen auswirken. Zum Beispiel, obligatorische Beratung oder Mediation (wie in Schweden und einigen US-Bundesstaaten) könnten impulsive Scheidungen verringern. Umgekehrt kann eine Wohlfahrtspolitik, die Alleinerziehende unterstützt, eine Scheidung eher möglich machen. Sorgerecht und Unterhaltsrecht für Kinder spielen ebenfalls eine Rolle: Wenn das Gesetz die Versorgung der Kinder und des weniger gut verdienenden Ehepartners sicherstellt, können sich die Ehepartner freier fühlen, sich scheiden zu lassen. In Ländern, in denen es keine solche Unterstützung gibt, bleiben Eltern (insbesondere Mütter) möglicherweise um der Kinder willen in der Ehe. Die Daten zeigen, dass die Scheidungsrate dort höher ist, wo der Staat Sicherheitsnetze bereitstellt (z. B. fällt die großzügige Sozialhilfe in Nordeuropa mit einer hohen Scheidungsrate zusammen, da die Menschen nicht riskieren, durch das Verlassen einer Ehe zu verarmen). Einige Länder (vor allem Malaysia, Indonesien) haben versucht, die Familien zu stärken, indem sie die Scheidungsverfahren verschärften oder gemeinschaftliche Versöhnungsprogramme durchführten - mit gemischten Ergebnissen. Die COVID-19-Pandemie ist ein aktuelles Beispiel für das Zusammenspiel von Politik und Umständen: Abriegelungen führten zunächst zu einer fallen lassen der Scheidungen im Jahr 2020 weltweit (die Gerichte waren geschlossen und die Paare verschoben ihre Trennung). In einigen Regionen kam es danach jedoch zu einem Wiederanstieg der Scheidungen, da der Nachholbedarf abgebaut wurde (z. B. Lettlands Die Scheidungsrate stieg 2021-22 sprunghaft an, nachdem sie 2020 gesunken war).
Zusammengefasst, der gesellschaftliche Kontext ist entscheidend zum Verständnis der Scheidungsraten. Gesellschaften mit hohen Scheidungsraten zeichnen sich im Allgemeinen durch eine säkulare Einstellung, leicht zugängliche rechtliche Verfahren, eine größere Gleichberechtigung der Geschlechter und eine Betonung der individuellen Entscheidungsfreiheit aus. Gesellschaften mit niedrigen Scheidungsraten zeichnen sich häufig durch eine starke religiöse oder clanbezogene Kontrolle, rechtliche Hindernisse und erhebliche soziale oder wirtschaftliche Strafen für Scheidungen (insbesondere für Frauen) aus. Es ist nicht so, dass die Menschen in Ländern mit geringer Scheidungsrate nie Eheschäden oder -konflikte erleben, sondern dass der Druck, verheiratet zu bleiben (oder das Fehlen von Scheidungsmechanismen), die Ehen auf dem Papier intakt hält. In Ländern mit hoher Scheidungsrate gibt es dagegen oft Unterstützungssysteme und gesellschaftliche Akzeptanz, die eine Beendigung der Ehe zu einem gangbaren Weg machen, wenn die Beziehung nicht zufriedenstellend ist. Wie eine Forschungszusammenfassung es ausdrückt, "Im Allgemeinen gilt: Je höher das Bildungsniveau der Frauen eines Landes, desto höher die Scheidungsrate. Sozialwissenschaftler stellen auch fest, dass die Einstellung zur Scheidung sowohl die Scheidungsrate beeinflusst als auch von ihr beeinflusst wird: Je häufiger eine Scheidung in einer Gesellschaft vorkommt, desto mehr verliert sie an Stigmatisierung, wodurch eine Rückkopplungsschleife der Normalisierung entsteht.
Schlussfolgerung und wichtige Erkenntnisse
Die Scheidungsraten in aller Welt spiegeln ein komplexes Zusammenspiel von kulturellen Werten, rechtlichen Rahmenbedingungen, wirtschaftlichen Bedingungen und sozialem Wandel wider. Ein paar wichtigste Ergebnisse aus diesem umfassenden Überblick sind:
- Globaler Trend: In der zweiten Hälfte des 20. Jahrhunderts stiegen die Scheidungsraten weltweit an, insbesondere in den westlichen Ländern, doch im 21. Jahrhundert hat sich der Trend geteilt. In vielen Ländern mit hohem Einkommen hat sich die Zahl der Scheidungen seit dem Jahr 2000 stabilisiert oder ist zurückgegangen, während sie in einigen Ländern mit mittlerem Einkommen immer noch ansteigt. In den 2020er Jahren wird die durchschnittliche rohe Scheidungsrate in der Welt bei etwa 1-2 pro 1.000aber hinter diesem Durchschnitt verbergen sich große Unterschiede.
- Höchste Raten: Die Länder mit der höchsten Scheidungsprävalenz liegen in der Regel in Osteuropa (ex-sowjetisch)Teile von Westeuropaund einige Neue Welt Länder. Gemessen am Anteil der Ehen, die mit einer Scheidung enden, Spanien (~85%) führen, gefolgt von Ländern wie Russland (~74%)**Belgien (~70%)*, und Kuba (~56%). Dies sind Orte mit entweder sehr niedrigen Heiratsraten oder sehr freizügigen Scheidungspraktiken (oder beidem). Gemessen an der jährlichen rohen Scheidungsrate gehören zu den Spitzenreitern Malediven, Kasachstan/Weißrussland/Georgien (~3,5-3,8), und kürzlich ein Ausreißer Nord-Mazedonien. Im Allgemeinen gilt eine Scheidungsrate von über 3 pro 1.000 als hoch im heutigen Kontext. Länder mit einer hohen Scheidungsrate haben oft eine rasche soziale Liberalisierung oder wirtschaftliche Umwälzungen erlebt, die die traditionellen Familienbande gelockert haben.
- Niedrigste Preise: Das andere Extrem, Südasiatische und westafrikanische Länder haben die niedrigsten Scheidungsraten. Indiens ~1% Die Scheidungshäufigkeit ist bezeichnend für die starke Norm der Dauerhaftigkeit von Ehen. Andere Länder mit sehr niedrigen Raten (unter 0,5 pro 1.000 oder <10% der Ehen) sind Bhutan, Sri Lanka, Vietnam, Guatemala, Peru und einige afrikanische Länder. An vielen dieser Orte sind Scheidungen gesellschaftlich und manchmal auch rechtlich nicht erwünscht. Außerdem gibt es in einigen Staaten eine gesetzliches Verbot der Ehescheidung (Philippinen, Vatikan), wodurch die Zinssätze effektiv bei Null gehalten werden.
- Regionale Unterschiede: Europa hat eine Aufteilung zwischen Ost (sehr hohe Scheidung in den baltischen und slawischen Ländern) und West/Nord (hoch, aber etwas niedriger, mit einigen Rückgängen) und Süd (mäßig, Anstieg von einer niedrigen Basis). Nordamerika/Ozeanien sind relativ homogen, und die Scheidungsrate ist mäßig hoch (40-50% der Eheschließungen). Lateinamerika ist im Allgemeinen mäßig bis gering, steigt aber nach der Legalisierung an. Asien reicht von einem hohen Wert in Ostasien bis zum niedrigsten Wert in Südasien, während Südostasien einen mittleren Wert aufweist. Afrika ist weitgehend niedrig, mit Ausnahme einiger weniger Länder, die sich nach oben bewegen. Diese Unterschiede hängen häufig mit der vorherrschenden Religion und der kulturellen Geschichte sowie dem Entwicklungsstand der einzelnen Regionen zusammen.
- Historische Verschiebung: In den meisten Ländern wurden Scheidungen im späten 20. Jahrhundert sehr viel häufiger, aber der "Scheidungsboom" hat sich verlangsamt. In den USA und vielen europäischen Ländern beispielsweise sind die Scheidungsraten seit ihrem Höchststand zurückgegangen, da weniger Menschen impulsiv heiraten und sich die Erwartungen an die Qualität der Ehe weiterentwickeln. Einige Experten vermuten, dass wir eine Stabilisierung erleben, bei der diejenigen, die jetzt heiraten, dies bewusster tun, was möglicherweise zu dauerhafteren Ehen führt (wie die sinkenden Scheidungsraten für Millennials in einigen Daten zeigen). Gleichzeitig gibt es in anderen Teilen der Welt (z. B. in Teilen Asiens und des Nahen Ostens) Eingabe von ihre Zeit der zunehmenden Scheidungen, da die Modernisierung greift.
- Sozialer Kontext: Hohe Scheidungsraten sind nicht per se "gut" oder "schlecht" - sie können auf eine größere persönliche Freiheit und Gleichberechtigung der Geschlechter hinweisen (Menschen können schlechte Ehen verlassen), sie können aber auch Ausdruck von sozialem Stress oder einer Schwächung der Unterstützungsnetze sein. Niedrige Scheidungsraten können auf stabile Familien und ein starkes Engagement hinweisen, aber möglicherweise auch auf fehlende Optionen für diejenigen, die sich in unhaltbaren Ehen befinden. Hinter einer sehr niedrigen Scheidungsrate in einer Gesellschaft können sich zum Beispiel viele informelle Trennungen verbergen oder Frauen, die aufgrund fehlender Alternativen misshandelt werden. Um die Scheidungsstatistiken zu verstehen, muss man also über die Zahlen hinausgehen und die SozialgefügeSo geht z. B. eine hohe Scheidungsrate in Schweden mit einem hohen Maß an Lebenszufriedenheit und Gleichstellung der Geschlechter einher, während eine niedrige Scheidungsrate in Afghanistan mit einer geringen Autonomie der Frauen einhergeht.
- Auswirkungen von COVID-19: Ein kurzer Hinweis: Die COVID-19-Pandemie führte zunächst zu einem Rückgang der Scheidungen im Jahr 2020 (da Gerichte geschlossen wurden und Paare ihre Entscheidungen hinauszögerten). In einigen Ländern (z. B. im Vereinigten Königreich und in Teilen der USA) kam es dann 2021-2022 zu einem Wiederanstieg. Die Nettoauswirkungen der Pandemie werden noch untersucht, aber es ist wahrscheinlich verzögert viele Scheidungen, anstatt sie zu verhindern. Sie führte auch neue Belastungen (Sperrkonflikte) ein, die bei einigen langfristig zu mehr Scheidungen führen könnten. Anekdotische Belege aus China und europäischen Ländern zeigen beispielsweise einen Anstieg der Scheidungsanträge unmittelbar nach Aufhebung der Sperren. Insgesamt hat die Pandemie deutlich gemacht, dass externe Ereignisse die Familiendynamik vorübergehend verändern können, dass sich die Grundtendenzen danach aber wieder einstellen.
Zusammengefasst, Die weltweiten Scheidungsraten sind ein Spiegel des gesellschaftlichen Wandels. In Ländern, die sich in einem raschen gesellschaftlichen Wandel befinden (wirtschaftliche Entwicklung, Verschiebung der Geschlechterrollen, Säkularisierung), kommt es häufig zu einem Anstieg der Scheidungen, da etablierte Normen wegbrechen und der Einzelne der persönlichen Entfaltung den Vorrang gibt. Umgekehrt sind Scheidungen in Gesellschaften, die fest an traditionellen Strukturen festhalten - sei es aus freien Stücken oder unter Zwang - nach wie vor selten. Da sich die Welt weiter entwickelt und die kulturellen Werte sich verändern, ist es wahrscheinlich, dass in immer mehr Ländern die Scheidungsraten steigen werden - bis zu einem gewissen Grad. In der Tat stellen die Vereinten Nationen fest, dass der Anteil der geschiedenen/getrennten Erwachsenen weltweit zugenommen hat und sich von den 1970er bis zu den 2000er Jahren verdoppelt hat. Dennoch könnten wir auch sehen KonvergenzIn Ländern mit extrem hoher Scheidungsrate könnte sich die Situation stabilisieren (da Ehen seltener werden oder Beziehungen durch eine bessere Abstimmung gestärkt werden), während in Ländern mit extrem niedriger Scheidungsrate die Zahl der Scheidungen im Zuge der Liberalisierung allmählich zunehmen könnte.
Aus politischer Sicht legen die Daten nahe, dass ein Gleichgewicht zwischen ehelicher Stabilität und individuellem Wohlergehen gefunden werden muss. Gesellschaften mit hoher Scheidungsrate stehen vor der Herausforderung, Ein-Eltern-Familien zu unterstützen und auf die Bedürfnisse von Scheidungskindern einzugehen (die oft mit wirtschaftlichen und emotionalen Auswirkungen konfrontiert sind). Gesellschaften mit niedriger Scheidungsrate hingegen müssen die Rechte und das Wohlergehen von Personen berücksichtigen, die aufgrund von sozialem oder rechtlichem Druck in Ehen gefangen sind. Letztlich geht es nicht darum, die Scheidungsraten willkürlich nach oben oder unten zu treiben, sondern darum, sicherzustellen, dass die Ehe wird aus freien Stücken geschlossen und verlassen und dass Familien und Einzelpersonen die Unterstützung erhalten, die sie unabhängig von der Struktur benötigen. Das globale Bild der Scheidung ist von auffallender Vielfalt geprägt - von einer nahezu universellen lebenslangen Ehe in einigen Kulturen bis hin zu einer Ehe, die in anderen eine Münze ist - was unterstreicht, wie sehr die Ehe, eine der persönlichsten Institutionen, von der sie umgebenden Gesellschaft geprägt wird.
Quellen: Daten zusammengestellt von den Vereinten Nationen Demografisches JahrbuchDie Daten stammen aus den Familiendatenbanken der Weltbank und der OECD, aus nationalen statistischen Ämtern (z. B. Eurostat für die EU-Länder, CDC/NCHS für die USA) und aus der akademischen Forschung über länderübergreifende Scheidungsdeterminanten. Die Zahlen zu den Heirats- und Scheidungsraten in den einzelnen Ländern stammen aus den letzten verfügbaren amtlichen Aufzeichnungen, wie oben angegeben, wobei Unsere Welt in Daten historische Trenddarstellungen liefert. Diese Quellen zusammen gewährleisten eine glaubwürdige und aktuelle Darstellung der globalen Scheidungsmuster.