Úvod a klíčové ukazatele
Rozvody jsou v posledních desetiletích celosvětově stále častější, i když se trendy v jednotlivých zemích a regionech značně liší. V celosvětovém měřítku se hrubá míra rozvodovosti (roční počet rozvodů na 1 000 obyvatel) od 70. let 20. století do roku 2000 zhruba zdvojnásobila. Například v Evropské unii vzrostla míra rozvodovosti z přibližně 1,5 % na 1 obyvatele v roce 2000. 0,8 na 1 000 obyvatel v roce 1964 na 2,0 na 1 000 obyvatel v roce 2023, ačkoli počet sňatků ve stejném období klesl o 50%. Vzorce rozvodovosti však zdaleka nejsou jednotné - odrážejí společenské normy, právní rámec a demografické trendy jednotlivých zemí. Dva klíčové způsoby měření rozvodovosti:
- Hrubá míra rozvodovosti: počet rozvodů na 1 000 osob v daném roce. Udává roční četnost rozvodů v populaci.
- Poměr rozvodů a sňatků (procento rozvodovosti): počet rozvodů v poměru k počtu sňatků, často vyjádřený v procentech (např. rozvody na 100 sňatků). Tím se získá přibližná hodnota celoživotní riziko že manželství nakonec skončí rozvodem. Například poměr 50% naznačuje, že přibližně polovina manželství končí rozvodem.
Je důležité interpretovat tyto ukazatele v kontextu. Hrubé míry mohou být ovlivněny částí populace, která je svobodná, nebo věkovou strukturou. Procento rozvodovosti je hrubým odhadem celoživotního rizika rozvodu; předpokládá, že současné vzorce sňatečnosti a rozvodovosti zůstávají konstantní, ačkoli ve skutečnosti se skutečné celoživotní míry rozvodovosti vypočítávají sledováním sňatkových kohort v čase. Přesto tyto ukazatele dohromady poskytují užitečný obraz o rozvodovosti.
Statistiky rozvodů v jednotlivých zemích (nejnovější údaje)
Následující tabulky uvádějí míru rozvodovosti v zemích s dostupnými spolehlivými údaji, včetně údajů za poslední rok, hrubé míry rozvodovosti, hrubé míry sňatečnosti a odhadovaného procenta manželství, která končí rozvodem (poměr rozvodů a sňatků). To nabízí rozdělení rozvodovosti podle jednotlivých zemí.
Evropa
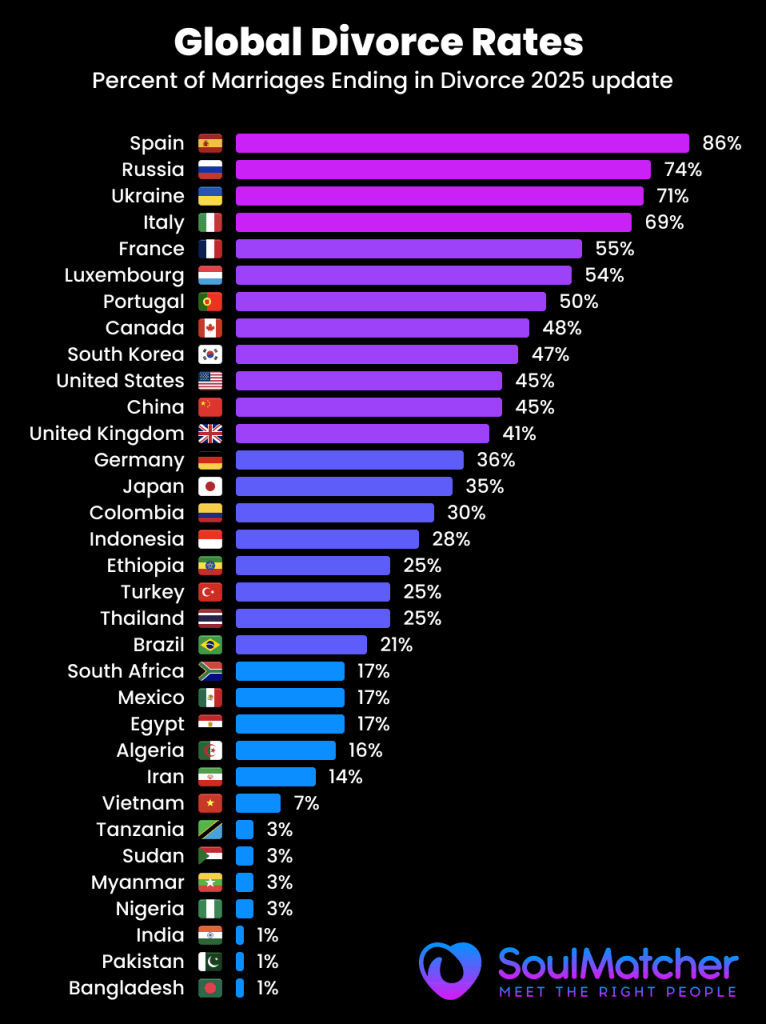
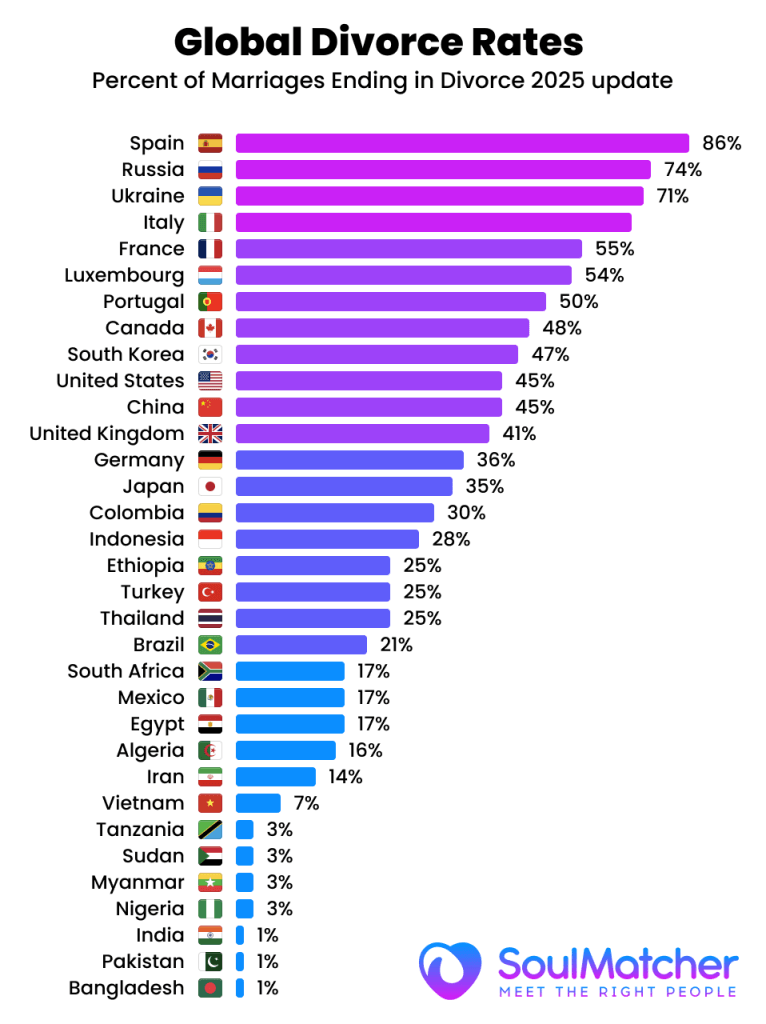
V Evropě je jedna z nejvyšších rozvodovostí na světě. V mnoha evropských a bývalých sovětských zemích došlo koncem 20. století k prudkému nárůstu rozvodů a v současnosti 40-90% manželství končí rozvodem. Naproti tomu několik evropských zemí, které teprve nedávno legalizovaly nebo normalizovaly rozvody, vykazuje mnohem nižší míru rozvodovosti.
| Země | Data Rok | Rozvody na 1 000 obyvatel | Počet sňatků na 1 000 obyvatel | % manželství končících rozvodem |
|---|---|---|---|---|
| Španělsko | 2020 | 1.6 | 1.9 | 84.2% (světová výška) |
| Rusko | 2020 | 3.9 | 5.3 | 73.6% |
| Ukrajina | 2020 | 2.9 | 4.1 | 70.9% |
| Francie | 2016 | 1.9 | 3.7 | 51.3% |
| Portugalsko | 2023 | 2.0 | 2.8 | 47% |
| Švédsko | 2018 | 2.5 | 5.0 | 50.0% |
| Itálie | 2018 | 1.5 | 3.2 | 46.9% |
| Německo | 2017 | 1.9 | 4.9 | 38.8% |
| Spojené království (E&W) | 2015 | 1.8 | 4.4 | 40.9% |
| Polsko | 2018 | 1.7 | 5.1 | 33.3% |
| Rumunsko | 2018 | 1.6 | 7.4 | 21.6% |
| Irsko | 2017 | 0.7 | 4.6 | 15.2% |
| Malta | 2018 | 0.7 | 5.8 | 12.1% |
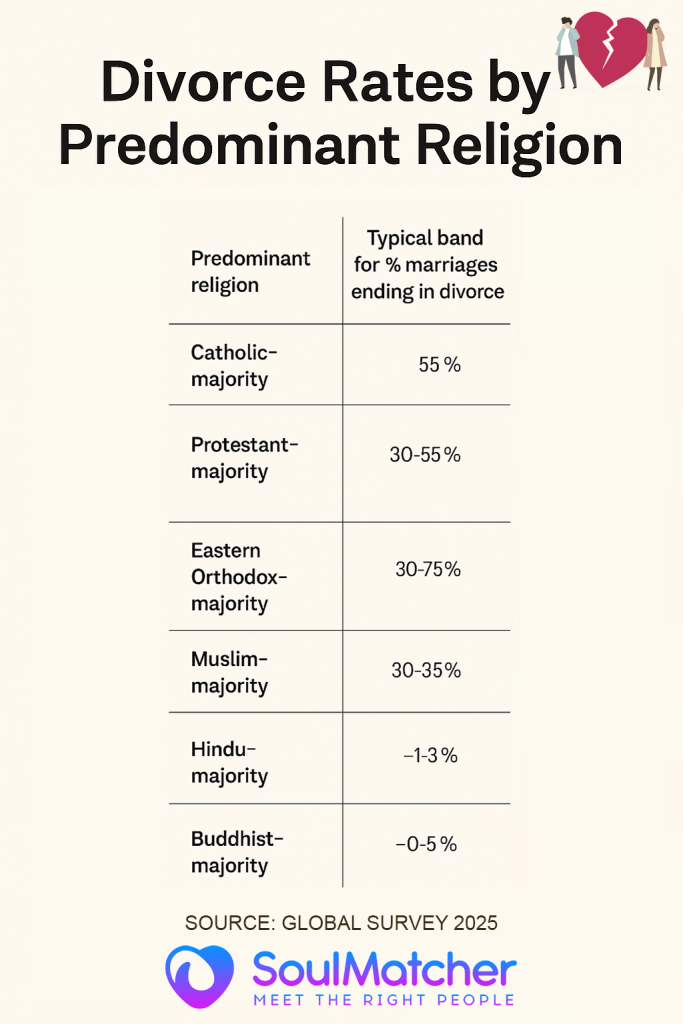
Evropa: Španělsko vyniká s odhadovaným 90% manželství končících rozvodem, patří k nejvyšším na světě. Naproti tomu tradičně katolické země, které teprve nedávno povolily rozvody (např. Malta (2011), Irsko (1996)) mají stále velmi nízkou rozvodovost (méně než 0,8 rozvodů na 1 000 obyvatel) a jen asi 2,5 rozvodů na 1 000 obyvatel. 12-15% manželství, která končí rozvodem. Hlavní západoevropské národy se pohybují mezi těmito hodnotami: např. přibližně. 50% sňatků v Francie končí rozvodem, ~41% v UKa ~39% na adrese Německo. Severské země mají přibližně 45-50% manželství končících rozvodem (např. Švédsko ~50%). V mnoha východoevropských a postsovětských státech je vysoká rozvodovost: např, Rusko (74%) a Ukrajina (71%). V těchto zemích došlo během sovětské éry a po ní k prudkému nárůstu rozvodovosti. Mezitím si několik východoevropských zemí udržuje nižší míru rozvodovosti (Rumunsko ~22%, tradičně díky konzervativnějším normám). Celkově se hrubá míra rozvodovosti v Evropě většinou pohybuje v rozmezí od cca. 1 až 3 na 1 000 osob, přičemž medián se pohybuje kolem 1,5-2,5 na 1 000 obyvatel, ale procento rozvodů a sňatků se značně liší v důsledku rozdílné míry sňatečnosti. K dlouhodobému nárůstu počtu rozvodů v Evropě částečně přispěly právní změny - rozvody byly legalizovány v Itálii (1970), Španělsku (1981), Irsku (1996) a na Maltě (2011), což přispělo k nárůstu počtu rozvodů v těchto zemích v čase.
Severní Amerika
V Severní Americe je také poměrně vysoká rozvodovost, i když v některých oblastech se v poslední době projevuje klesající tendence.
| Země | Data Rok | Rozvody na 1 000 obyvatel | Počet sňatků na 1 000 | % manželství končících rozvodem |
|---|---|---|---|---|
| Spojené státy americké | 2020 | 2.3 | 5.1 | 45.1% |
| Kanada | 2008 | 2.1 | 4.4 | 47.7% |
| Kuba | 2010 | 2.9 | 5.2 | 55.8% |
| Mexiko | 2020 | ~1.0 | ~5,5 (odhad) | ~20% (odhad) |
| Chile | 2009 | 0.7 | 3.3 | 21.2% |
| Guatemala | 2019 | (velmi nízká) | (vysoká) | ~5% (odhad) |
Severní Amerika: Na stránkách Spojené státy americké má dlouhodobě jednu z nejvyšších hrubých rozvodovostí mezi velkými zeměmi (na počátku 80. let 20. století dosahovala téměř 5,0 %). V roce 2000 činila míra rozvodovosti v USA 4,0 na 1 000 obyvatel, od té doby však klesla na 2,3 na 1 000 od roku 2020. V současné době asi 42-45% manželství v USA končí rozvodem. Sousední Kanada je podobná, zhruba 48% manželství končících rozvodem (k roku 2008). V Karibiku a Střední Americe, Kuba má výjimečně vysokou rozvodovost - přibližně o 10 %. 56% manželství končí rozvodem, což odráží historicky snadnou rozvodovost. Naproti tomu, Mexikohrubá míra rozvodovosti (~1,0) je poměrně nízká; vzhledem k silným rodinným tradicím se odhaduje, že pouze jeden člověk se rozvede. 20-25% mexických manželství končí rozvodem (přibližná hodnota na základě posledních údajů). Některé latinskoamerické země měly v minulosti velmi nízkou míru rozvodovosti (v některých případech proto, že rozvody byly donedávna zakázané nebo neobvyklé). Např, Chile legalizovala rozvody až v roce 2004 a v roce 2009 měla stále nízkou míru rozvodovosti (0,7 na 1000, ~21% manželství). Obecně rozvodovost v Latinské Americe v 21. století stoupá, ale kulturní normy udržují míru rozvodovosti na mírné úrovni - mnoho zemí Střední Ameriky (např. Guatemala, Honduras) hlásí výrazně méně než 1 rozvod na 1 000 obyvatel, což znamená méně než 10% manželství končících legálním rozvodem (i když neformální rozchody mohou být vyšší).
Asia
Asie vykazuje nejširší rozsah rozvodovosti, které odrážejí různé kultury a zákony. Některé východoasijské a euroasijské země mají jednu z nejvyšších rozvodovostí, zatímco v jižní Asii je rozvodovost nejnižší.
| Země | Data Rok | Rozvody na 1 000 obyvatel | Počet sňatků na 1 000 | % manželství končících rozvodem |
|---|---|---|---|---|
| Čína | 2018 | 3.2 | 7.2 | 44.4% |
| Jižní Korea | 2019 | 2.2 | 4.7 | 46.8% |
| Japonsko | 2019 | 1.7 | 4.8 | 35.4% |
| Izrael | 2009 | 1.8 | 6.5 | 27.7% |
| Saúdská Arábie | 2020 | 2.1 | 5.6 | 37.5% |
| Kazachstán | 2021 | 2.5 | 7.3 | 34.3% |
| Krocan | 2018 | 1.7 | 6.8 | 25.0% |
| Vietnam | 2015 | 0.4 | 5.7 | 7.0% |
| Indie | ~2018 | 0.1 | ~10 | ~1% (nejnižší) |
| Filipíny | NEUPLATŇUJE SE | rozvod nezákonný | - | 0% (zákonný zákaz) |
Asie: Několik stránek Východní Asie země prošly rychlými společenskými změnami a v současné době mají vysokou míru rozvodovosti. Jižní Korearozvodovost v 90. až 2000. letech 20. století dramaticky vzrostla a do roku 2019 se rozvedlo přibližně 47% manželství končí rozvodem. Čínarozvodovost v USA se v roce 2000 zvýšila na přibližně 2,5 %. 3,2 na 1 000 (44% sňatků) do roku 2018, což odráží urbanizaci a usnadnění rozvodových řízení - ve skutečnosti se počet čínských rozvodů zvyšoval každý rok po dobu 16 let až do roku 2019. (Nový zákon o "ochlazení" v roce 2021 způsobil náhlý pokles počtu rozvodů v Číně, ale diskutuje se, zda bude trvalý, nebo jen oddálí rozvody). Japonsko dosáhla rozvodovosti vrcholu kolem roku 2002 a poté klesla; v roce 2019 je v Japonsku rozvodovost 1,7 na 1000 obyvatel, přičemž zhruba polovina rozvodovosti připadá na 1 000 obyvatel. 35% manželství, která končí rozvodem. Na adrese Jihovýchodní Asie, bývá míra rozvodovosti střední až nízká, což je částečně způsobeno náboženskými a kulturními normami. Např, Vietnam pouze zprávy 0,4 rozvodů na 1 000 osob a ~7% manželství, která končí rozvodem. Indonésie má také nízkou hrubou míru rozvodovosti (~1,2), přestože je zde vysoký počet muslimů (islám rozvody povoluje, ale v praxi jsou stále vzácné). Jižní Asie má nejnižší rozvodovost na světě - Indie hrubá míra rozvodovosti je jen asi 0,1 na 1 000a pouze kolem 1% indických manželství končí rozvodem. Tento extrémně nízký podíl se přičítá silnému společenskému stigmatu vůči rozvodu, tlaku širší rodiny a právním překážkám v Indii. Také další jihoasijské a blízkovýchodní země uvádějí velmi nízké procento rozvodů (např. Srí Lanka ~0,15 na 1000, tedy několik procent sňatků). Na druhou stranu, v některých částech Blízkého východu se vyskytuje vyšší rozvodovost: například, Saúdská Arábie a Kazachstán (středoasijská země s muslimskou většinou) viz 30-40% manželství, která končí rozvodem. Ve státech Perského zálivu jsou rozvody poměrně časté - např. Kuvajt v roce 2010 činila přibližně 42% - k tomu přispěly i liberální zákony pro muže, ačkoli ženy se potýkají s většími překážkami. Zejména, Filipíny (a Vatikán) jsou jedinými zeměmi, které se mohou pochlubit kde je rozvod zcela nezákonný, což má za následek v podstatě 0% manželství, která právně končí rozvodem (zrušení manželství je možné, ale je vzácné). Díky těmto zákonným zákazům je míra rozvodovosti nulová, i když k rozchodům stále dochází.
Afrika
Spolehlivých statistik o rozvodech v Africe je málo, ale dostupné údaje naznačují, že rozvodovost je až na výjimky obecně nižší. Mnoho afrických manželství je uzavíráno na základě zvyklostí nebo náboženství a může se rozvádět mimo formální právní systém, takže oficiální počty rozvodů jsou nízké.
| Země | Data Rok | Rozvody na 1 000 obyvatel | Počet sňatků na 1 000 | % manželství končících rozvodem |
|---|---|---|---|---|
| Jihoafrická republika | 2009 | 0.6 | 3.5 | 17.1% |
| Egypt | 2021 | 2.4 | (odhad ~9) | ~25% (odhad) |
| Mauricius | 2010 | 1.4 | 8.2 | 17.1% |
| Nigérie | ~2016 | (velmi nízká) | (vysoká) | (<5%) (est.) |
| Maroko/Alžírsko | ~2018 | ~1-1.5 | ~7-8 | ~15-20% (odhad) |
Afrika: V mnoha afrických zemích je hrubá míra rozvodovosti je nižší než 1 rozvod na 1000 obyvatel., což svědčí o relativně malém počtu formálních rozvodů. Např, Jihoafrická republika - jeden z nejlépe zdokumentovaných případů - měl pouze 0,6 rozvodů na 1 000 osob v roce 2009, což odpovídá přibližně 17% manželství, která končí rozvodem. K nízkému počtu zaznamenaných rozvodů přispívá několik faktorů: silný společenský/náboženský nesouhlas s rozvodem v některých částech Afriky, převažující neformální rozchody nebo polygamní svazky, které nemusí skončit soudem, a praktické obtíže (zejména pro ženy) při získávání rozvodů. V severní Africe a na Blízkém východě, kde manželství ovlivňuje islámské právo, je rozvod právně povolen, ale často je spojen s určitými podmínkami. Egypt, kde se například v posledních letech zvyšuje počet rozvodů (2,4 na 1 000 obyvatel v roce 2021), což je jedna z nejvyšších měr v Africe, protože se pomalu mění postoje, ačkoli se ženy musí často vzdát finančních práv, aby mohly iniciovat rozvod. Další africké země, jako např. Mauricius (17%) a Maroko (~15-20%) mají střední poměr rozvodů a sňatků. Africké společnosti si obecně cení manželské stability a k mnoha rozvodům dochází bez oficiálních statistik (např. prostřednictvím starších v komunitě). Za zmínku stojí, že v některých částech subsaharské Afriky, nestabilita odborů může být vysoká (v důsledku faktorů, jako je socioekonomický stres nebo ovdovění), ale ty nejsou v údajích vždy zaznamenány jako "rozvod". Pokud údaje existují, často ukazují určitý vzorec: městské a vzdělané obyvatelstvo má vyšší míru rozvodovosti než venkovské obyvatelstvo, což odráží větší autonomii párů při rozchodu.
Oceánie
Rozvodovost v Oceánii je podobná jako v západních zemích.
| Země | Data Rok | Rozvody na 1 000 obyvatel | Počet sňatků na 1 000 | % manželství končících rozvodem |
|---|---|---|---|---|
| Austrálie | 2020 | 1,9 (odhad) | 4,6 (odhad) | ~41% |
| Nový Zéland | 2020 | 1,5 (odhad) | 3,6 (odhad) | ~42% |
| Fidži / Tichomořské ostrovy | ~2018 | (nízká) | (různě) | (10-20%) (est.) |
Oceánie: Austrálie a Nový Zéland rozvodovost srovnatelná s Evropou a Severní Amerikou. Přibližně 40-45% manželství v Austrálii a na Novém Zélandu skončí rozvodem. Například na Novém Zélandu činila hrubá míra rozvodovosti v roce 2022 1,6 rozvodů na 1 000 osob a na 1 000 existujících manželských párů připadalo v tomto roce přibližně 7,6 rozvodů - což znamená podobné riziko rozvodu přibližně 40%. V obou zemích docházelo k nárůstu rozvodovosti koncem 20. století, ale v posledních letech se míra rozvodovosti stabilizovala nebo mírně klesla v souvislosti s poklesem sňatečnosti. Naproti tomu mnohé menší tichomořské ostrovní státy (Fidži, Samoa atd.) mají konzervativnější rodinné struktury a omezené údaje, ale neoficiální důkazy naznačují relativně nízkou rozvodovost (často pod 1 na 1 000 obyvatel).
Poznámky k tabulce: Údaje odrážejí poslední dostupný rok (v závorce). "% manželství končících rozvodem" se vypočítá jako rozvody ÷ sňatky × 100 pro daný rok (vysoký odhad celoživotního rizika rozvodu). Skutečné celoživotní pravděpodobnosti rozvodu se mohou mírně lišit, zejména v zemích, které procházejí rychlými změnami. Přesto je toto procento užitečným srovnávacím ukazatelem. U těchto údajů uvádíme autoritativní zdroje včetně Demografické ročenky OSN a národních statistických agentur. Obecně, celosvětová rozvodovost se pohybuje od méně než 0,5 rozvodu na 1000 obyvatel (v několika málo společnostech s nízkou rozvodovostí) až po přibližně 3-4 rozvody na 1000 obyvatel v zemích s nejvyšší rozvodovostí., zatímco podíl manželství končících rozvodem se pohybuje od méně než 5% do více než 90%, což je ohromující rozpětí, které odráží právní a kulturní extrémy.
Nejvyšší a nejnižší rozvodovost na světě
V celosvětovém měřítku nejvyšší hrubá míra rozvodovosti (na 1 000 obyvatel) se vyskytuje ve směsici postsovětských států, částí Evropy a několika dalších regionů. Podle nejnovějších údajů OSN patří mezi země s nejvyšší roční mírou rozvodovosti:
- Severní Makedonie: 9,6 rozvodů na 1 000 obyvatel (2023) - nedávný prudký nárůst řadí tento malý balkánský stát na první místo. (Tato neobvykle vysoká míra v roce 2023 může být způsobena nahromaděním rozvodů po pandemii nebo jinými anomáliemi).
- Maledivy: 5,5 na 1 000 (2020) - v minulosti byla na Maledivách extrémně vysoká rozvodovost (v roce 2002 dosáhla 10,97 rozvodů na 1 000 obyvatel, což je Guinnessův rekord), což se připisuje kulturním normám, které se týkají vícečetných manželství. Dokonce i v posledních letech vede ve světě s více než 5 rozvody na 1 000 obyvatel.
- Bělorusko, Gruzie, Moldavsko: v okolí 3,7-3,8 na 1 000 osob (2021-2022). V čele seznamu je několik bývalých republik SSSR, což odráží vysokou míru akceptace rozvodů ve společnosti a ekonomické napětí v postsovětské éře. Například Bělorusko mělo 3,7 a Moldavsko 3,7 na 1 000 obyvatel.
- Lotyšsko, Litva: ~2,5-2,9 na 1 000 osob (2022). Pobaltské státy mají trvale vysokou míru rozvodovosti, přičemž v Lotyšsku je v současnosti nejvyšší v EU - 2,8.
- Spojené státy americké: ~2,3 na 1 000 (2020) - zatímco dříve patřily Spojené státy mezi špičku, nyní se jejich míra snížila a ve srovnání s východní Evropou je mírná.
Pokud jde o "celoživotní" riziko rozvodu (podíl manželství končících rozvodem), vedoucí představitelé se mírně liší, což poukazuje na vliv nízké sňatečnosti v některých místech. Mezi země s nejvyšším procentem rozvodovosti patří např:
- Španělsko: ~85% manželství končí rozvodem. Po legalizaci rozvodů v roce 1981 se ve Španělsku prudce zvýšila rozvodovost a vzhledem k relativně malému počtu nově uzavřených manželství je podle posledních údajů poměr rozvodů extrémně vysoký.
- Rusko: 73-74%; Ukrajina: ~71%; Bělorusko: ~60-65% (odhad). Tyto slovanské země mají vysokou fluktuaci manželství - hodně sňatků, ale ještě více rozvodů v poměru k tomuto počtu.
- Kuba: ~56%; Francie: ~51%; Švédsko: 50%. Mnoho západních zemí se pohybuje kolem hranice 50%, což znamená, že zhruba polovina manželství se nakonec rozpadne (často citované "polovina manželství končí rozvodem" platí zhruba pro USA, Francii, Spojené království atd.).
Naproti tomu nejnižší rozvodovost se vyskytují ve společnostech s právními nebo kulturními překážkami rozvodu. Patří mezi ně:
- Indie: Pouze o 1% manželství končí rozvodem. Hrubá míra rozvodovosti v Indii (~0,1) patří k nejnižším zaznamenaným hodnotám. Silné stigma a očekávání, že manželství vydrží, vedou k velmi malému počtu rozvodů.
- Bhútán, Srí Lanka, Vietnam: Pouze 5-7% manželství končí rozvodem. V těchto asijských zemích je hrubá míra rozvodovosti výrazně nižší než 0,5 na 1 000 obyvatel. Například na Srí Lance je tato míra 0,15 a rozvody často vyžadují zdlouhavé právní procesy.
- Kolumbie a mnoha afrických zemí: Často 10-20% pravděpodobnost rozvodu. Mnoho afrických a latinskoamerických zemí se silným vlivem katolické církve nebo komunity (např. Guatemala, Kongo, Nigérie) uvádí velmi nízký počet rozvodů.
- Filipíny a Vatikán: 0% (žádný právní rozvod). Na Filipínách lze manželství ukončit pouze anulováním nebo smrtí. Není překvapením, že oficiální míra rozvodovosti je fakticky nulová a země se často objevuje na konci světových žebříčků rozvodovosti.
Obrázek: Mapa rozvodovosti ve světě ("šance na rozvod" podle zemí). Teplejší barvy (červená) označují vyšší míru rozvodovosti nebo pravděpodobnost rozvodu, zatímco chladnější barvy (zelená) označují nižší míru rozvodovosti. Šedá barva označuje nedostatečné údaje. Tato mapa zdůrazňuje, že rozvody jsou nejčastější v bývalém SSSR, v některých částech Evropy a v Severní Americe, zatímco nejméně časté jsou v jižní Asii, v některých částech Afriky a v některých zemích jihovýchodní Asie.
Jak ukazuje mapa a údaje, míra rozvodovosti se v jednotlivých regionech výrazně liší. Obecně platí, že ve vyspělých regionech a regionech s liberálnějšími společenskými normami (Evropa, Severní Amerika, Oceánie) je rozvodovost vyšší, zatímco v rozvojových regionech s tradičnějšími nebo restriktivnějšími normami (jižní Asie, Blízký východ, Afrika) je nižší. Existují však významné výjimky - například bohatší východoasijské země (Japonsko, Korea) mají mírnou míru rozvodovosti a některé chudší země (například země bývalé sovětské sféry) mají vysokou míru rozvodovosti v důsledku jedinečných historických faktorů. Kulturní postoje, náboženství a právní struktury tyto výsledky silně ovlivňují, jak je uvedeno dále.
Historické trendy rozvodovosti v hlavních zemích
Míra rozvodovosti v mnoha zemích se vyvíjela podle tvar obráceného U v posledních více než 50 letech: prudký nárůst v 70. až 90. letech 20. století, poté nárůst nebo pokles v roce 2000. Načasování a výška vrcholu se v jednotlivých zemích liší, což odráží různé společenské změny. Následující obrázek 1 znázorňuje vývoj rozvodovosti ve vybraných zemích napříč kontinenty a poukazuje na tyto různé vzorce.
Obrázek 1: Vývoj rozvodovosti (rozvody na 1 000 osob za rok) ve vybraných zemích, 1960-2020. Mnoho západních zemí (např. Spojené státy americké, Spojené království, Norsko) zaznamenala od 60. let 20. století nárůst rozvodovosti, která dosáhla vrcholu v 70.-80. letech 20. století a poté klesala. V některých východoasijských a východoevropských zemích (Jižní Korea, Estonsko, Polsko) dosáhl vrcholu později (přibližně na počátku roku 2000), kdy se rozvody staly více akceptovanými. Jiné, jako např. Krocan vykazují do roku 2010 trvalý nárůst z nízké základny. (Zdroj dat: OECD/OSN, prostřednictvím Našeho světa v datech.)
V Spojené státy americké, hrubá míra rozvodovosti vzrostla z ~2,2 v roce 1960 na historicky nejvyšší hodnotu 5,3 na 1 000 obyvatel v roce 1981 v důsledku zavedení zákonů o rozvodech bez zavinění a změny rolí mužů a žen. Od té doby neustále klesá - v roce 2021 se snížila na 2,5, což je nejnižší hodnota za posledních 50 let. Tento pokles se částečně připisuje tomu, že mladší generace uzavírají manželství později a selektivněji, což vede ke stabilnějším manželstvím. Riziko rozvodu u prvních manželství v USA poněkud pokleslo (v současnosti se odhaduje celkově kolem 40-45%). Podobně je tomu i v případě tzv, Kanada a Austrálie v 80. letech 20. století dosáhla vrcholu a poté klesala. Například rozvodovost v Austrálii prudce vzrostla po zahájení rozvodů bez rozvodu v roce 1975, poté se stabilizovala; procento manželství končících rozvodem v Austrálii se ve skutečnosti snížilo. dolů z přibližně 50% v 80. letech na ~41% v současnosti.
Na adrese Západní Evropa, ve většině zemí došlo v letech 1970-1990 k prudkému nárůstu rozvodovosti. Na stránkách UK dosáhla v polovině 90. let 20. století nejvyšší hodnoty ~3 rozvody na 1 000 obyvatel (po reformě z 90. let, která rozvody zmírnila) a od té doby klesla na ~1,8. Skandinávské v zemích, kde došlo k jednomu z prvních nárůstů (např. Švédsko dosáhlo v 80. letech 20. století hodnoty ~2,5 na 1 000 obyvatel a nadále se pohybuje kolem 2,0-2,5). Jižní Evropa se zpozdila - země jako Itálie, Španělsko a Portugalsko měly velmi nízkou rozvodovost, dokud nebyl rozvod uzákoněn (Španělsko 1981, Portugalsko 1975, Itálie 1970). Po legalizaci došlo v těchto zemích k prudkému nárůstu: Ve Španělsku se rozvodovost zvýšila zejména poté, co zákon z roku 2005 usnadnil postupy, což přispělo k současnému vysokému počtu rozvodů. V Portugalsku se rozvodovost v letech 1990-2000 rovněž rychle zvyšovala. Zajímavé je, že některé západní země v poslední době zaznamenaly klesající rozvodovost: např. Německo, Nizozemsko, Francie od počátku roku 2000 zaznamenaly mírný pokles hrubé rozvodovosti. Často se to přičítá tomu, že méně lidí uzavírá první manželství (takže se jich méně může rozvést), a také pravděpodobně častějšímu soužití a vyššímu věku při sňatku (což snižuje riziko rozvodu). Na stránkách . EU jako celek rozvodovost dosáhla vrcholu kolem roku 2006, kdy činila 2,1, a poté mírně klesla na 1,8-2,0 do roku 2019.
Na adrese Východní Evropa a bývalý SSSR, přechod v 90. letech vedl k velmi vysoké rozvodovosti. Rusko a Ukrajina vrcholu dosáhla v 90.-2000. letech 20. století, kdy se míra hrubé nezaměstnanosti pohybovala kolem 4-5 na 1 000 obyvatel, což odráželo sociální nepokoje a nové svobody v postsovětské éře. Od té doby se míra v Rusku zmírnila na přibližně 3,9 (od roku 2020), ale v porovnání s počtem sňatků zůstává vysoká. Pobaltské státy (Estonsko, Lotyšsko, Litva) zaznamenaly prudký nárůst rozvodovosti na konci 90. let 20. století a zůstaly na vysoké úrovni (lotyšská míra 2,8 v roce 2023 je jednou z nejvyšších v Evropě). Některé východoevropské země mají v poslední době klesající tendenci rozvodovosti (např. Polsko dosáhla vrcholu kolem roku 2006 a poté mírně klesla), pravděpodobně v důsledku kulturního důrazu na rodinu a menšího počtu sňatků mezi mladšími lidmi (Polsko má stále jednu z nejvyšších sňatečností v Evropě).
Asie trendy jsou různorodé. Japonsko rozvodovost po druhé světové válce postupně rostla, v roce 2002 dosáhla hodnoty ~2,1 a poté do roku 2019 klesla na ~1,6-1,7 v důsledku stárnutí populace a menšího počtu mladých lidí, kteří uzavírají manželství. Jižní Korea později, ale prudší nárůst: rozvodovost se ztrojnásobila z 1,1 v roce 1990 na ~3,5 v roce 2003, poté klesla na ~2,2 v roce 2010 a ustálila se. Tento vzorec - vrchol a následný pokles - v Koreji a Japonsku lze částečně vysvětlit generačními změnami (kohorta ženatých a vdaných v 80.-90. letech 20. století měla vysokou rozvodovost, ale mladší kohorty uzavírají méně manželství a jsou o něco stabilnější). Čína je pozoruhodná neustálým nárůstem rozvodovosti v průběhu roku 2000: z velmi nízkého základu v 80. letech 20. století dosáhla hrubá míra rozvodovosti v Číně v roce 2018 hodnoty 3,2. Nedávné zavedení 30denní čekací lhůty čínskou vládou v roce 2021 vedlo k údajnému poklesu registrovaných rozvodů o 70% bezprostředně poté, což však může svědčit spíše o opožděných nebo neregistrovaných rozchodech než o skutečné změně chování (některé čínské páry spěchaly s rozvodem před zákona, prudký nárůst v roce 2020 a následný pokles v roce 2021). Z dlouhodobého hlediska odráží čínský trend rostoucí individualismus a menší stigmatizaci rozvodů v městských oblastech. Na Indie, naproti tomu míra rozvodovosti zůstává v průběhu času trvale mizivá - neexistuje žádný srovnatelný "rozvodový boom" a historické stigma udržuje míru rozvodovosti blízko nuly (ačkoli v posledních letech dochází v Indii k pomalému nárůstu rozvodů ve městech).
Mnoho Blízký východ a Severní Afrika zemí chybí dlouhodobé údaje, ale některé (jako např. Egypt a Jordan) ukazují, že počet rozvodů v roce 2010 stoupá, pravděpodobně v důsledku postupných společenských změn a právních reforem. Například v Egyptě se rozvodovost v průběhu roku 2010 zvyšovala a v roce 2021 dosáhla nejvyšší hodnoty (2,4 rozvodu na 1 000 obyvatel). Země Perského zálivu jako jsou SAE, Katar a Kuvajt, měly údajně v 90. až 2000. letech 20. století vysokou míru rozvodovosti (v Kataru dosáhla kolem roku 2005 hodnoty ~2,2 na 1000 obyvatel a v Kuvajtu byla ještě vyšší), po níž následovala určitá stabilizace. Tyto trendy se často shodují s modernizací a zvyšováním vzdělání žen, což vede k větší ochotě ukončit nešťastné manželství.
Na adrese Afrika, historické údaje jsou omezené. Neoficiální údaje však naznačují, že v některých jihoafrických zemích se rozvody staly po roce 2000 běžnějšími (např. Botswana a Jihoafrická republika v devadesátých letech došlo k nárůstu, poté k mírnému poklesu). Od roku 2004 se počet zaznamenaných rozvodů v Jihoafrické republice pomalu snižuje, což je pravděpodobně způsobeno menším počtem formálních sňatků a větším počtem soužití. Naproti tomu v zemích jako např. Etiopie nebo Nigérie mají historicky stále velmi nízkou formální rozvodovost, i když míra rozvodovosti může být vyšší.
Lze shrnout, že hlavní vyspělé země již většinou překonaly vrchol "rozvodové revoluce" - rozvodovost, která stoupala koncem 20. století, se v 21. století zastavila nebo začala klesat. Rozvojové země se nacházejí v různých fázích: některé z nich (zejména východní Asie, části Latinské Ameriky) zažily prudký nárůst rozvodovosti v roce 2000 a nyní se vyrovnávají, zatímco jiné (jižní Asie, části Afriky) zatím nezaznamenaly výrazný nárůst kvůli přetrvávajícím kulturním omezením.
Regionální a ekonomické vzorce
Při porovnávání napříč kontinenty a ekonomické skupiny, se objevují jasné vzorce v prevalenci rozvodů:
- Evropa a Severní Amerika: Tyto regiony s vysokými příjmy mají střední až vysoká rozvodovost. Průměrná hrubá míra rozvodovosti v zemích OECD s vysokými příjmy je přibližně 1,8 na 1 000 v posledních letech. V rámci Evropy je průměr EU ~2,0. Téměř všechny západní země umožňují rozvody bez zavinění a mají minimální právní překážky, což má za následek značnou úroveň rozvodovosti. V rámci této skupiny však existují rozdíly: Severní a západní Evropa (a Severní Amerika/Oceánie) mají tendenci mít procento rozvodovosti kolem 40-50%, zatímco tradičně katolické nebo pravoslavné země (Irsko, Polsko, Itálie) mají nižší, i když rostoucí procento. Hospodářský rozvoj a urbanizace mají tendenci korelovat s vyšší mírou rozvodovosti, protože finanční nezávislost žen a jejich sociální jistoty umožňují opustit manželství. Studie skutečně zjistily, že v zemích s vyšším vzděláním žen a vyšším podílem pracovní síly je rozvodovost obecně vyšší. To je patrné například ve Skandinávii (vysoká rovnost žen a mužů, relativně vysoká rozvodovost) oproti méně rozvinutým regionům. Extrémně vysoká rozvodovost může zároveň odrážet také sociální narušení - například Rusko a jeho sousedé (země s vyššími středními příjmy) překonávají mnohé bohatší země v míře rozvodovosti, a to díky socioekonomickému napětí a slabšímu vlivu náboženství na politiku.
- Asie: Asie se vzpírá zobecnění, protože zahrnuje jak některé z nejnižší a nejvyšší rozvodové společnosti. Obecně, Východní Asie a Střední Asie zemí (např. Korea, Čína, Kazachstán) je nyní míra rozvodovosti srovnatelná se západními zeměmi. Naproti tomu, Jižní Asie (Indie, Bangladéš, Pákistán) zůstává extrémně nízká rozvodovost kvůli kulturním normám (patriarchální rodinný systém, stigmatizace, tradice domluvených sňatků). Jihovýchodní Asie převážně muslimské země, jako je Indonésie a Malajsie, mají nízký počet rozvodů, ačkoli islámské právo umožňuje mužům se poměrně snadno rozvádět (což může zvýšit počet neformálních rozvodů). V těchto regionech udržuje nízkou míru rozvodovosti rodinná soudržnost a společenský stud. Např, Vietnam a Thajsko mají nízkou míru, částečně proto, že širší rodina často zprostředkovává manželské problémy. Ekonomické faktory také hrají roli - v chudších agrárních společnostech v Asii je nižší rozvodovost, protože rodina je ekonomickou jednotkou a ženám může chybět podpora mimo manželství. S růstem ekonomiky a s příležitosti, které ženy získávají, však rozvodovost zpravidla roste (např. rychlý nárůst rozvodovosti v městské Číně se časově shodoval s ekonomickou liberalizací). Pozoruhodné je, že země s restriktivními zákony o rozvodech (jako dosud Filipíny) nebo s požadavky na dlouhé odloučení přirozeně vykazují nízkou míru rozvodovosti.
- Blízký východ a severní Afrika: Tento region se vyznačuje mírnou rozvodovostí se značnou variabilitou. Obecně platí, že arabské státy Perského zálivu (např. Kuvajt, Katar, Spojené arabské emiráty) a severoafrické země hlásí hrubou míru rozvodovosti kolem 1-2 na 1000 obyvatel - ne tak vysokou jako Evropa, ale vyšší než jižní Asie. Kulturní normy silně odrazují ženy od iniciování rozvodu, ale možnost mužů zavrhnout manželku (v islámském právu) může vést k vyšší míře rozvodů iniciovaných muži. Nerovnost žen a mužů hraje roli: paradoxně některé země Blízkého východu s vysokou nerovností mezi muži a ženami. také mají relativně vysokou rozvodovost (protože muži se mohou svobodně rozvádět, zatímco ženy nesou následky). Naopak velmi nízká rozvodovost v místech, jako je Jemen nebo Sýrie, může odrážet jak společenský tlak, tak obtíže, s nimiž se ženy při rozvodu potýkají. V posledních letech modernizace mírně zvýšila rozvodovost v liberálnějších částech regionu (např. Tunisko, Írán, Turecko), protože právní reformy usnadňují rozvody a ženy se stávají vzdělanějšími. Například v Turecku je míra rozvodovosti sice jen 1,7 na 1 000 obyvatel, ale s vývojem tradičních rodinných struktur se plíživě zvyšuje.
- Latinská Amerika: V latinskoamerických zemích byla historicky nízká míra rozvodovosti, což bylo způsobeno vlivem katolické církve (v mnoha zemích byly rozvody zakázány až do konce 20. století). V posledních několika desetiletích, rozvody se staly legálními a běžnými v celé Latinské Americe.Většina latinskoamerických zemí má hrubý počet rozvodů kolem 1-2 na 1000 obyvatel (např. Brazílie ~1,4; Kolumbie ~0,7; Kostarika 2,6). Kuba je pozoruhodnou odchylkou s jednou z nejvyšších rozvodovostí na světě (více než 2,5 na 1 000 obyvatel a > 50% rozvodů manželství), což se často připisuje sekulární, sociálně liberální politice od kubánské revoluce. Poměrně vysokou míru rozvodovosti kolem 2,4-2,6 na 1 000 obyvatel vykazují také Dominikánská republika a Portoriko. Na druhé straně kulturně konzervativní národy, jako např. Chile a Peru zůstává nízká (v Chile vzrostla míra rozvodovosti nad 1,0 na 1 000 obyvatel až v roce 2010 po legalizaci rozvodů). Celkově lze říci, že s urbanizací Latinské Ameriky a zlepšováním práv žen se rozvodovost postupně zvyšuje, ale kultura zaměřená na rodinu ji udržuje pod západní úrovní. Důležité je, že neformální rozdělení a konsensuální svazky jsou v Latinské Americe běžné, což se nemusí odrážet ve statistikách rozvodovosti - mnoho párů se jednoduše rozejde bez zákonného rozvodu nebo nikdy formálně nesezdá, což ovlivňuje oficiální čísla.
- Afrika: Afrika je regionem s nejmenším počtem údajů, ale tradiční normy upřednostňují stabilitu manželství. Mnoho afrických zemí má dvojí systém manželství (občanský a zvykový); rozvody podle zvykového práva nemusí být oficiálně započítávány. Tam, kde údaje existují (Jihoafrická republika, Egypt, Mauricius, Keňa), se hrubé míry pohybují zhruba v rozmezí 0,5 až 2,0. Obecně, subsaharská Afrika zaznamenává nízkou rozvodovost. Například v Nigérii a Etiopii je míra rozvodovosti extrémně nízká. Jednou z výjimek byla Botswana, kde byla v 90. letech 20. století na africké poměry neobvykle vysoká rozvodovost (více než 10% manželství končilo rozvodem, což je pravděpodobně způsobeno matrilineární sociální strukturou), ale údaje jsou omezené. V afrických společnostech odrazují od rozvodu faktory jako cena nevěsty (věno) a zprostředkování komunitou. Nicméně polygamie a nesezdané soužití mohou vést k rozpadu vztahu, který není zachycen jako "rozvod". Pozoruhodné je, že země s vyšší gramotností a zaměstnaností žen v Africe (např. Jihoafrická republika, Mauricius) mají tendenci mít o něco vyšší míru rozvodovosti než země, kde mají ženy menší autonomii. Přesto je i v Jihoafrické republice míra rozvodovosti ve srovnání se západními zeměmi mírná. Ekonomický stres může být oboustranná: někdy rozbíjí rodiny, ale také může z manželství učinit nezbytné ekonomické partnerství, které se lidé zdráhají opustit.
Od ekonomická klasifikace perspektivu, ekonomiky s vysokými příjmy hlásí v průměru vyšší rozvodovost než ekonomiky s nízkými příjmy. Vyspělé země mají nejen vyšší oficiální míru rozvodovosti, ale také liberálnější zákony a sociální záchranné sítě na podporu rozvedených osob. Naproti tomu v zemích s nízkými příjmy je manželství často spjato s rodinnou ctí, finančním zabezpečením žen a společenským postavením, což rozvody potlačuje. Například všech deset zemí s nejnižší mírou rozvodovosti dosahuje špatných výsledků v indexu nerovnosti žen a mužů OSN (což svědčí o tradičnějších, omezujících rolích žen). To naznačuje, že velmi nízká rozvodovost může být spíše známkou omezeného postavení žen nebo právních překážek než manželského štěstí.. Ze srovnání vyplývá, že mnohé země s nejnižší mírou rozvodovosti (např. Uzbekistán, Mongolsko, Pákistán) se řadí na nízké příčky v rovnosti žen a mužů, zatímco mezi zeměmi s nejvyšší mírou rozvodovosti je řada zemí relativně rovných (např. Švédsko, Belgie), ale některé země nikoli (Rusko, Bělorusko). Stručně řečeno, větší osobní svoboda a rovnost žen a mužů mají tendenci zvyšovat rozvodovost až do určité míry., ale extrémně vysoká rozvodovost může být také důsledkem sociální nestability nebo vývoje norem v zemích se středními příjmy. Společnosti s vysokou mírou rozvodovosti se pohybují na různých ekonomických úrovních, ale jejich společným rysem je kulturní akceptace ukončování manželství. Naopak společnosti s nejnižší rozvodovostí často prosazují přísná právní/náboženská omezení nebo sociální postihy v souvislosti s rozvodem.
Sociální, právní a kulturní souvislosti
K rozvodu nedochází ve vzduchoprázdnu - je hluboce ovlivněn společenskými normami, zákony a postoji k manželství. V tomto článku zkoumáme, jak sociální, právní a kulturní faktory ovlivňují rozdíly v míře rozvodovosti:
- Kulturní/náboženské normy: Pravděpodobně nejsilnějším faktorem ovlivňujícím míru rozvodovosti je kulturní postoj k trvalosti manželství. Ve společnostech, kde je manželství považováno za posvátný, nerozlučitelný svazek (často podložený náboženstvím), jsou rozvody vzácné. Například v Indie a v mnoha muslimských zemích je rozvod značně stigmatizován. Rodiny mohou tlačit na páry, aby zůstaly spolu, a to i v nešťastných situacích nebo v situacích, kdy jsou zneužívány, aby se vyhnuly hanbě. V Indii je manželství často chápáno jako "doživotní" a rozvod může být natolik společensky stigmatizován, že se rozpadá pouze ~1% manželství. Podobně v historicky převážně katolických zemích (např. Filipíny, Irsko, Polsko), náboženská doktrína proti rozvodům udržovala jejich počet na velmi nízké úrovni, dokud nedošlo k právním změnám. Naopak kultury, které kladou důraz na individuální štěstí a osobní spokojenost, mají tendenci vykazovat vyšší míru rozvodovosti. Ve velké části Evropy a Severní Ameriky je dnes rozvod, ačkoli je politováníhodný, společensky přijatelný a poměrně běžný. Tato akceptace výrazně vzrostla od 60. let 20. století v důsledku sekularizace. Například rostoucí sekularizace v např. Západní Evropa odpovídalo většímu počtu rozvodů (např. Španělsko přechod od katolické diktatury k sekulární demokracii na konci 20. století umožnil nárůst rozvodovosti na 85% manželství). Východoasijské země ovlivněné konfuciánstvím (Čína, Korea, Japonsko) si tradičně cenily rodinné soudržnosti a měly nízkou rozvodovost, ale jak se tyto společnosti modernizovaly a stávaly se více individualistickými, rozvody ztratily část svého tabu - důkazem je prudký nárůst v Jižní Koreji na začátku roku 2000 a stálý vzestup v Číně. Je pozoruhodné, že i v rámci jednotlivých zemí jsou rozvody častější u městského, sekulárního obyvatelstva než u náboženských nebo venkovských komunit. Např. Spojené státy americké, evangelikální křesťanské komunity mají často o něco nižší míru rozvodovosti, než je celostátní průměr, což je způsobeno tím, že náboženství od rozvodů odrazuje, zatímco liberálnější komunity mají míru rozvodovosti vyšší.
- Právní přístup a reformy: Rozhodujícím faktorem je snadnost nebo obtížnost rozvodu. Pokud je rozvod nezákonné nebo silně omezené, jsou sazby přirozeně velmi nízké. Viděli jsme, že v Filipíny a Vatikán, kde rozvod není povolen, jsou oficiální sazby nulové. V zemích, které vyžadují dlouhou dobu odloučení, specifické důvody (rozvod z viny) nebo vzájemnou dohodu, je míra rozvodovosti obecně nižší než v zemích s rychlým rozvodem bez viny. Např, Malta při legalizaci rozvodů v roce 2011 původně vyžadovala čtyřletou odluku, což zpočátku udržovalo nízkou míru rozvodovosti. Irsko má stále požadovanou dobu odloučení (nedávno zkrácenou ze čtyř na dva roky), což částečně vysvětluje jeho nízkou míru (~15%). Naproti tomu národy s rychlé rozvody bez zavinění mají vyšší sazby. Zavedení zákonů o rozvodech bez zavinění v USA (70. léta 20. století) a Austrálii (1975) vedlo k okamžitému nárůstu počtu žádostí o rozvod, protože páry již nemusely prokazovat provinění. Dnes většina západních zemí umožňuje rozvod po vzájemné dohodě bez udání důvodu, což normalizuje vyšší míru rozvodovosti. Některé země dokonce zjednodušují postupy (např. Norsko a Švédsko po krátké čekací lhůtě umožňují podání online). Podle srovnávací analýzy patří mezi země s nejjednodušším a nejméně zatěžujícím rozvodovým řízením Norsko, Švédsko, Španělsko, Mexiko, Slovinsko, Argentina, které mají podle očekávání střední až vysokou míru rozvodovosti. Naopak země s velmi složitými rozvodovými zákony - např, Pákistán (kde ženy musí jít k soudu a prokázat důvody, zatímco muži se mohou jednostranně vzdát) nebo Egypt (kde se ženy musí vzdát finančních práv, aby se rozvedly bez zavinění "khula") - je méně rozvodů nebo více žádostí o rozvod podaných muži. Právní reformy mohou okamžitě ovlivnit statistiky: Chile až do roku 2004 se v podstatě nerozváděly; po legalizaci se v důsledku nahromaděné poptávky začaly registrovat tisíce rozvodů, což zvýšilo jejich počet. Brazílie došlo k nárůstu poté, co v roce 2010 zrušila povinnou dobu odloučení. Na adrese Čína, se zdá, že nedávný zákon o ochranné lhůtě dočasně snížil počet rozvodů tím, že do procesu vnesl třecí plochy. Velkou roli tedy hraje to, jak je právní systém vstřícný k rozvodům nebo jak je k nim odmítavý.
- Práva žen a ekonomická nezávislost: Důsledným zjištěním je, že rozvodovost roste s tím, jak ženy získávají socioekonomickou sílu.. Pokud mají ženy vzdělání, kariéru a zákonná práva, je méně pravděpodobné, že budou tolerovat nešťastné nebo utlačovatelské manželství. Historicky ve společnostech, kde ženy nemohly vlastnit majetek ani se samy živit, byly rozvody vzácné, protože často uvrhly ženy do chudoby nebo společenského vyhnanství. S tím, jak se tyto překážky odstraňovaly, rozvodů přibývalo. Například prudký nárůst rozvodů v západním světě v 70. letech 20. století souvisí s hnutím za osvobození žen a větším počtem pracujících žen (tzv. USA rozvodovost dosáhla vrcholu právě v době, kdy velké množství žen vstoupilo na trh práce a změnily se normy týkající se manželství). Ve východní Asii rostla rozvodovost v 90.-2000. letech 20. století souběžně s vyšším vzděláním žen a jejich zapojením do pracovního procesu. Jižní Korea, Čína, Tchaj-wan, atd. Na Blízkém východě údaje ukazují, že země s vyšší gramotností žen (např. Írán, Turecko) mají vyšší míru rozvodovosti než země, kde mají ženy menší postavení (např. Jemen, kde je rozvodovost velmi nízká). Existuje zde jasný genderový rozměr: na mnoha místech, ženy iniciují rozvod častěji než muži. když jsou toho schopny - například zhruba 70% rozvodů v USA podávají ženy, což je vzorec pozorovaný i v jiných vyspělých zemích, což naznačuje, že s rostoucí nezávislostí jsou ženy ochotnější ukončit neuspokojivé manželství. Mezitím v místech, kde rozvody iniciují převážně muži (kvůli zákonům nebo normám), jako jsou některé části arabského světa, mohou mít rozvody jiný společenský význam (někdy může vysoká míra rozvodovosti znamenat, že se muži často rozvádějí a znovu žení). Celkově lze říci, že zlepšení zákonných práv (např. zákony o manželském majetku, vymáhání výživného na děti) a sociální podpora (např. menší stigmatizace rozvedených žen) přispívají k vyšší míře rozvodovosti tím, že odstraňují praktické překážky.
- Ekonomický stres a urbanizace: Problém je, že prosperita i chudoba mohou rozvody ovlivňovat různými způsoby. Ekonomická stabilita může usnadnit rozvod, protože partneři nejsou nuceni zůstat spolu kvůli přežití. Současně, ekonomický stres (nezaměstnanost, inflace) může vést k rozpadu manželství. Například po rozpadu Sovětského svazu přispěly hospodářské otřesy pravděpodobně k nestabilitě manželství - v Rusku se během hospodářské krize v 90. letech 20. století zvýšila rozvodovost. V Řecku údajně vzrostla rozvodovost během nedávné finanční krize. Na druhou stranu recese může také dočasně nižší rozvodovost, pokud páry odkládají nákladné soudní řízení nebo si nemohou dovolit rozdělit domácnost. To se projevilo během celosvětové recese v roce 2008, kdy některé země zaznamenaly mírný pokles rozvodovosti. Urbanizace má tendenci zvyšovat rozvodovost: ve městech je tradiční dohled nad rodinou slabší a lidé jsou vystaveni rozmanitějším životním stylům (a pokušením). Města také nabízejí větší anonymitu a podpůrné sítě pro rozvedené osoby. Například nejvyšší míra rozvodovosti v Číně je ve velkých městech, jako je Šanghaj a Peking, zatímco na venkově se rozvádí mnohem méně.
- Měnící se společenská očekávání: Moderní manželství mají často jiná očekávání (citové naplnění, sdílení rolí) než tradiční utilitární manželství. Někteří vědci tvrdí, že s rostoucími očekáváními klesá tolerance k neuspokojivému manželství, což vede k většímu počtu rozvodů. To bylo uváděno v souvislosti s USA: posun k manželstvím založeným na lásce a seberealizaci může vést k vyšší rozvodovosti, pokud tyto potřeby nejsou naplněny. Mladší kohorty na celém světě mají obecně liberálnější postoje k rozvodům než jejich rodiče, což postupně normalizuje rozvodovost. A Globální přehled OSN uvedl, že v roce 2000 se ve srovnání se 70. lety 20. století rozvedlo/rozvedlo dvakrát více lidí než ve svých 30 letech, což odráží nejen právní změny, ale také společenskou akceptaci toho, že člověk nemusí zůstat v nešťastném manželství. Navíc úbytek domluvených manželství a nárůst sňatků z lásky v regionech, jako je Asie, může paradoxně zvýšit rozvodovost: když si jednotlivci vybírají partnery na základě lásky, mohou se také rozhodnout odejít, pokud láska vyprchá, zatímco domluvená manželství byla spojena se silnějším tlakem rodiny, aby setrvala.
- Vliv společného soužití: V mnoha západních zemích se zvýšil společné soužití (nesezdané soužití) ovlivnila statistiky rozvodovosti. Soužití může sloužit jako "manželství na zkoušku" nebo jako alternativa k manželství. V některých zemích (např. Švédsko, Francie), mnoho párů žije ve společné domácnosti a dokonce má děti, aniž by uzavřely manželství. Některé z těchto svazků se rozpadají, aniž by se dostaly do statistik rozvodovosti. Kohabitace přispívají k poklesu počtu sňatků, což zase může snižovat hrubou rozvodovost (protože na začátku uzavírá manželství méně lidí). Kohabitace však může být oboustranná: může vyřadit slabší vztahy před sňatkem (což vede ke stabilnějším manželstvím), nebo může odrážet změnu, kdy ti, kteří by se vzali a rozvedli, místo toho jednoduše kohabitují a rozcházejí se. Celkově lze říci, že vzestup kohabitací v Evropě a Americe je jedním z důvodů, proč se počet rozvodů v poslední době ustálil nebo klesl - některé rozchody se prostě nepočítají jako "rozvody".
- Politika a podpůrné systémy: Některé vlády aktivně provádějí politiku, která ovlivňuje rozvodovost. Například, povinné poradenství nebo mediace (jako ve Švédsku a některých státech USA) by mohly snížit počet impulzivních rozvodů. Naopak sociální politika, která podporuje osamělé rodiče, může rozvody učinit životaschopnějšími. Zákony o péči o děti a výživném hraje také roli: pokud zákon zaručuje, že děti a méně vydělávající manželé budou zaopatřeni, mohou se manželé cítit svobodnější při rozvodu. V zemích, kde taková podpora chybí, mohou rodiče (zejména matky) zůstat v manželství kvůli dětem. Údaje ukazují vyšší rozvodovost tam, kde stát poskytuje záchranné sítě (např. štědré sociální dávky v severní Evropě se shodují s vysokou rozvodovostí, protože jednotlivci neriskují odchodem z manželství nouzi). Některé země (zejména Malajsie, Indonésie) se pokusily posílit rodiny zpřísněním rozvodových řízení nebo komunitními programy smíření, avšak se smíšenými výsledky. Pandemie COVID-19 je nedávným příkladem vzájemného působení politiky a okolností: výluky zpočátku způsobily drop rozvodů v roce 2020 na celém světě (soudy byly uzavřeny a páry rozchody odkládaly). V některých regionech však následně došlo k opětovnému nárůstu rozvodů, protože se uvolnila odložená poptávka (např. Lotyšsko rozvodovost po propadu v roce 2020 v letech 2021-22 vzrostla).
Shrnutí, společenský kontext je zásadní k pochopení míry rozvodovosti. Společnosti s vysokou rozvodovostí se obecně vyznačují sekulárním přístupem, dostupnými právními procesy, větší rovností pohlaví a důrazem na individuální volbu. Společnosti s nízkou rozvodovostí se často vyznačují silnou náboženskou nebo klanovou kontrolou, právními překážkami a významnými sociálními nebo ekonomickými sankcemi za rozvod (zejména pro ženy). Neznamená to, že by lidé v zemích s nízkou rozvodovostí nikdy nezažili rozpad manželství nebo konflikty, ale spíše to, že tlak na setrvání v manželství (nebo nedostatek mechanismů k rozvodu) udržuje manželství na papíře neporušené. Zatímco v zemích s vysokou rozvodovostí často existují podpůrné systémy a společenská akceptace, díky nimž je ukončení manželství v případě neuspokojivého vztahu schůdnou cestou. Jak se uvádí v jednom shrnutí výzkumu, "Obecně platí, že čím vyšší je vzdělanost žen v dané zemi, tím vyšší je v ní rozvodovost." Sociologové také upozorňují, že postoje k rozvodům ovlivňují i jsou ovlivňovány mírou rozvodovosti: jak se rozvody stávají ve společnosti běžnějšími, ztrácejí stigma a vytvářejí zpětnou vazbu normalizace.
Závěr a hlavní závěry
Rozvodovost na celém světě odráží složitou souhru kulturních hodnot, právních rámců, ekonomických podmínek a sociálních změn. Několik klíčová zjištění z tohoto komplexního přehledu:
- Globální trend: Ve druhé polovině 20. století došlo k celosvětovému nárůstu rozvodovosti, zejména v západních zemích, ale v 21. století se tento trend rozdvojil. V mnoha zemích s vysokými příjmy došlo od roku 2000 ke stabilizaci nebo poklesu rozvodovosti, zatímco některé země se středními příjmy jsou stále na vzestupu. Od roku 2020 je průměrná hrubá míra rozvodovosti ve světě zhruba 1-2 na 1 000, ale tento průměr zakrývá velké rozdíly.
- Nejvyšší sazby: Národy s nejvyšší rozvodovostí jsou zpravidla v těchto oblastech Východní Evropa (bývalý Sovětský svaz), části Západní Evropaa některé Nový svět zemí. Měřeno podílem manželství končících rozvodem, Španělsko (~85%) následují země jako Rusko (~74%), **Belgie (~70%)* a Kuba (~56%). Jedná se o místa s velmi nízkou sňatečností nebo velmi tolerantní rozvodovou praxí (nebo obojí). Měřeno podle roční hrubé míry nezaměstnanosti, mezi nejlepší místa patří např. Maledivy, Kazachstán/Bělorusko/Gruzie (~3,5-3,8) a nedávno odlehlou hodnotu Severní Makedonie. Obecně je v dnešním kontextu rozvodovost vyšší než 3 rozvody na 1000 obyvatel považována za vysokou. Země s vysokou rozvodovostí často prošly rychlou sociální liberalizací nebo ekonomickými otřesy, které rozvolnily tradiční rodinné vazby.
- Nejnižší sazby: Na druhou stranu, Země jižní Asie a západní Afriky mají nejnižší míru rozvodovosti. Indie ~1% rozvodovost je symbolem silné normy trvalosti manželství. Mezi další země s velmi nízkou mírou rozvodovosti (pod 0,5 na 1 000 nebo <10% manželství) patří např. Bhútán, Srí Lanka, Vietnam, Guatemala, Peru a některé africké země.. V mnoha těchto místech jsou rozvody společensky a někdy i právně nedoporučovány. V několika státech se navíc udržuje zákonný zákaz rozvodu (Filipíny, Vatikán), čímž fakticky udržuje sazby na nule.
- Regionální rozdíly: Evropa je rozdělena na východ (velmi vysoká rozvodovost v Pobaltí, slovanských zemích) a západ/sever (vysoká, ale o něco nižší, s určitým poklesem) a jih (mírná, stoupající z nízkého základu). Severní Amerika/Oceánie jsou relativně homogenní se středně vysokou rozvodovostí (40-50% manželství). Latinská Amerika je obecně rozvodovost mírná až nízká, i když po legalizaci stoupá. Asia se pohybuje od vysoké ve východní Asii po nejnižší v jižní Asii, v jihovýchodní Asii je průměrná. Afrika je převážně nízká, s výjimkou několika zemí, které se pohybují na vyšších úrovních. Tyto rozdíly často souvisejí s převládajícím náboženstvím a kulturní historií každého regionu a také s úrovní rozvoje.
- Historický posun: Ve velkých zemích se rozvody staly mnohem častějšími na konci 20. století, ale "rozvodový boom" se zpomalil. Například ve Spojených státech a mnoha evropských zemích se rozvodovost oproti svému vrcholu snížila, protože stále méně lidí uzavírá manželství impulzivně a očekávání ohledně kvality manželství se vyvíjejí. Někteří odborníci se domnívají, že jsme možná svědky stabilizace, kdy ti, kteří se nyní berou, tak činí s větším rozmyslem, což může vést k trvalejším manželstvím (jak je v některých údajích vidět na klesající rozvodovosti u mileniálů). Současně se v jiných částech světa (např. v některých částech Asie, na Blízkém východě) vstup na jejich období rostoucí rozvodovosti v souvislosti s modernizací.
- Sociální kontext: Vysoká rozvodovost není ve své podstatě "dobrá" nebo "špatná" - může znamenat větší osobní svobodu a rovnost pohlaví (lidé mohou opustit špatná manželství), ale může také odrážet sociální napětí nebo oslabení podpůrných sítí. Nízká rozvodovost může svědčit o stabilních rodinách a silných závazcích, ale také o možném nedostatku možností pro ty, kteří žijí v neudržitelných manželstvích. Například velmi nízká rozvodovost ve společnosti může skrývat mnoho neformálních rozchodů nebo ženy, které snášejí týrání kvůli nedostatku alternativ. Porozumění statistikám rozvodovosti proto vyžaduje, aby se kromě čísel hledělo i na jiné věci. sociální struktura: např. vysoká rozvodovost ve Švédsku koexistuje s vysokou úrovní životní spokojenosti a rovnosti pohlaví, zatímco nízká rozvodovost v Afghánistánu koexistuje s nízkou mírou autonomie žen.
- Dopad COVID-19: Krátká poznámka - pandemie COVID-19 zpočátku způsobila pokles rozvodů v roce 2020 (protože soudy byly uzavřeny a páry odkládaly rozhodnutí). V některých zemích (např. ve Spojeném království, v některých částech USA) pak došlo v letech 2021-2022 k opětovnému nárůstu. Čistý účinek pandemie se stále zkoumá, ale je pravděpodobné, že se zpožděné mnoho rozvodů, spíše než aby jim předcházel. Zavedla také nové stresové situace (konflikty kvůli uzamčení), které by mohly u některých z nich v dlouhodobém horizontu zvýšit počet rozvodů. Například neoficiální důkazy z Číny a evropských zemí ukazují na nárůst počtu rozvodů bezprostředně po zrušení výluk. Celkově pandemie poukázala na to, že vnější události mohou dočasně změnit rodinnou dynamiku, ale základní trendy se poté obnoví.
Závěrem, globální rozvodovost je zrcadlem společenských změn.. V zemích, které procházejí rychlými společenskými změnami (ekonomický rozvoj, změna genderových rolí, sekularizace), často dochází k nárůstu rozvodovosti, protože se boří zavedené normy a jednotlivci dávají přednost osobnímu naplnění. Naopak ve společnostech, které se pevně drží tradičních struktur - ať už z vlastního rozhodnutí, nebo z donucení - zůstávají rozvody vzácné. S dalším vývojem světa a vývojem kulturních hodnot je pravděpodobné, že ve více zemích bude rozvodovost do určité míry stoupat. Organizace spojených národů totiž uvádí, že podíl rozvedených/rozvedených dospělých osob na celém světě vzrostl a od 70. let 20. století do roku 2000 se zdvojnásobil. Přesto můžeme být také svědky konvergence: země s extrémně vysokou rozvodovostí se mohou stabilizovat (protože sňatky se stávají méně častými nebo se vztahy upevňují díky lepšímu sladění) a země s extrémně nízkou rozvodovostí se mohou postupně zvyšovat s liberalizací postojů.
Z politického hlediska údaje naznačují, že je třeba vyvážit manželskou stabilitu s individuálním blahobytem. Společnosti s vysokou rozvodovostí se potýkají s problémy podpory neúplných rodin a řešení potřeb rozvedených dětí (které často čelí ekonomickým a emocionálním dopadům). Na druhé straně společnosti s nízkou rozvodovostí musí brát v úvahu práva a blahobyt jednotlivců, kteří uvízli v manželství v důsledku společenského nebo právního tlaku. V konečném důsledku není cílem svévolně zvyšovat nebo snižovat míru rozvodovosti, ale zajistit, aby manželství se uzavírá a rozvádí na základě svobodné volby a aby rodiny a jednotlivci měli potřebnou podporu bez ohledu na strukturu. Celosvětový obraz rozvodovosti je nápadně různorodý - od téměř univerzálního celoživotního manželství v některých kulturách až po manželství, které je v jiných kulturách jako bernou mincí - a podtrhuje, jak je manželství, jedna z nejosobnějších institucí, hluboce formováno širší společností, která ho obklopuje.
Zdroje: Údaje shromážděné z Organizace spojených národů Demografická ročenka, rodinné databáze Světové banky a OECD, národní statistické agentury (např. Eurostat pro země EU, americká CDC/NCHS pro Ameriku) a akademický výzkum determinantů rozvodovosti napříč zeměmi. Údaje o míře sňatečnosti a rozvodovosti v jednotlivých zemích pocházejí z nejnovějších dostupných oficiálních záznamů, jak je uvedeno výše, přičemž Our World in Data poskytuje vizualizace historických trendů. Tyto zdroje společně zajišťují věrohodné a aktuální zobrazení globálních vzorců rozvodovosti.